Forming, storming, norming, performing, and …chloroforming?

In 1965, Bruce Tuckman proposed a “developmental sequence in small groups.” According to his influential theory, most successful groups go through four stages with rhyming names:

  1. Forming: Group members get to know each other and define their task.
  2. Storming: Through argument and disagreement, power dynamics emerge and are negotiated.
  3. Norming: After conflict, groups seek to avoid conflict and focus on cooperation and setting norms for acceptable behavior.
  4. Performing: There is both cooperation and productive dissent as the team performs the task at a high level.

Fortunately for organizational science, 1965 was hardly the last stage of development for Tuckman’s theory!

Twelve years later, Tuckman suggested that adjourning or mourning reflected potential fifth stages (Tuckman and Jensen 1977). Since then, other organizational researchers have suggested other stages including transforming and reforming (White 2009), re-norming (Biggs), and outperforming (Rickards and Moger 2002).

What does the future hold for this line of research?

To help answer this question, we wrote a regular expression to identify candidate words and placed the full list is at this page in the Community Data Science Collective wiki.

The good news is that despite the active stream of research producing new stages that end or rhyme with -orming, there are tons of great words left!

For example, stages in a group’s development might include:

  • Scorning: In this stage, group members begin mocking each other!
  • Misinforming: Group that reach this stage start producing fake news.
  • Shoehorning: These groups try to make their products fit into ridiculous constraints.
  • Chloroforming: Groups become languid and fatigued?

One benefit of keeping our list in the wiki is that the organizational research community can use it to coordinate! If you are planning to use one of these terms—or if you know of a paper that has—feel free to edit the page in our wiki to “claim” it!


Also posted on the Community Data Science Collective blog. Although credit for this post goes primarily to Jeremy Foote and Benjamin Mako Hill, the other Community Data Science Collective members can’t really be called blameless in the matter either.

Natural experiment showing how “wide walls” can support engagement and learning

Seymour Papert is credited as saying that tools to support learning should have “high ceilings” and “low floors.” The phrase is meant to suggest that tools should allow learners to do complex and intellectually sophisticated things but should also be easy to begin using quickly. Mitchel Resnick extended the metaphor to argue that learning toolkits should also have “wide walls” in that they should appeal to diverse groups of learners and allow for a broad variety of creative outcomes. In a new paper, Sayamindu Dasgupta and I attempted to provide an empirical test of Resnick’s wide walls theory. Using a natural experiment in the Scratch online community, we found causal evidence that “widening walls” can, as Resnick suggested, increase both engagement and learning.

Over the last ten years, the “wide walls” design principle has been widely cited in the design of new systems. For example, Resnick and his collaborators relied heavily on the principle in the design of the Scratch programming language. Scratch allows young learners to produce not only games, but also interactive art, music videos, greetings card, stories, and much more. As part of that team, Sayamindu was guided by “wide walls” principle when he designed and implemented the Scratch cloud variables system in 2011-2012.

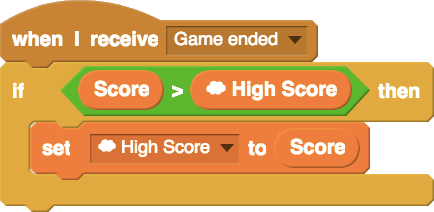
While designing the system, Sayamindu hoped to “widen walls” by supporting a broader range of ways to use variables and data structures in Scratch. Scratch cloud variables extend the affordances of the normal Scratch variable by adding persistence and shared-ness. A simple example of something possible with cloud variables, but not without them, is a global high-score leaderboard in a game (example code is below). After the system was launched, we saw many young Scratch users using the system to engage with data structures in new and incredibly creative ways.

cloud-variable-script
Example of Scratch code that uses a cloud variable to keep track of high-scores among all players of a game.

Although these examples reflected powerful anecdotal evidence, we were also interested in using quantitative data to reflect the causal effect of the system. Understanding the causal effect of a new design in real world settings is a major challenge. To do so, we took advantage of a “natural experiment” and some clever techniques from econometrics to measure how learners’ behavior changed when they were given access to a wider design space.

Understanding the design of our study requires understanding a little bit about how access to the Scratch cloud variable system is granted. Although the system has been accessible to Scratch users since 2013, new Scratch users do not get access immediately. They are granted access only after a certain amount of time and activity on the website (the specific criteria are not public). Our “experiment” involved a sudden change in policy that altered the criteria for who gets access to the cloud variable feature. Through no act of their own, more than 14,000 users were given access to feature, literally overnight. We looked at these Scratch users immediately before and after the policy change to estimate the effect of access to the broader design space that cloud variables afforded.

We found that use of data-related features was, as predicted, increased by both access to and use of cloud variables. We also found that this increase was not only an effect of projects that use cloud variables themselves. In other words, learners with access to cloud variables—and especially those who had used it—were more likely to use “plain-old” data-structures in their projects as well.

The graph below visualizes the results of one of the statistical models in our paper and suggests that we would expect that 33% of projects by a prototypical “average” Scratch user would use data structures if the user in question had never used used cloud variables but that we would expect that 60% of projects by a similar user would if they had used the system.

Model-predicted probability that a project made by a prototypical Scratch user will contain data structures (w/o counting projects with cloud variables)

It is important to note that the estimated effective above is a “local average effect” among people who used the system because they were granted access by the sudden change in policy (this is a subtle but important point that we explain this in some depth in the paper). Although we urge care and skepticism in interpreting our numbers, we believe our results are encouraging evidence in support of the “wide walls” design principle.

Of course, our work is not without important limitations. Critically, we also found that rate of adoption of cloud variables was very low. Although it is hard to pinpoint the exact reason for this from the data we observed, it has been suggested that widening walls may have a potential negative side-effect of making it harder for learners to imagine what the new creative possibilities might be in the absence of targeted support and scaffolding. Also important to remember is that our study measures “wide walls” in a specific way in a specific context and that it is hard to know how well our findings will generalize to other contexts and communities. We discuss these caveats, as well as our methods, models, and theoretical background in detail in our paper which now available for download as an open-access piece from the ACM digital library.


This blog post, and the open access paper that it describes, is a collaborative project with Sayamindu Dasgupta. Financial support came from the eScience Institute and the Department of Communication at the University of Washington. Quantitative analyses for this project were completed using the Hyak high performance computing cluster at the University of Washington.

Is English Wikipedia’s ‘rise and decline’ typical?

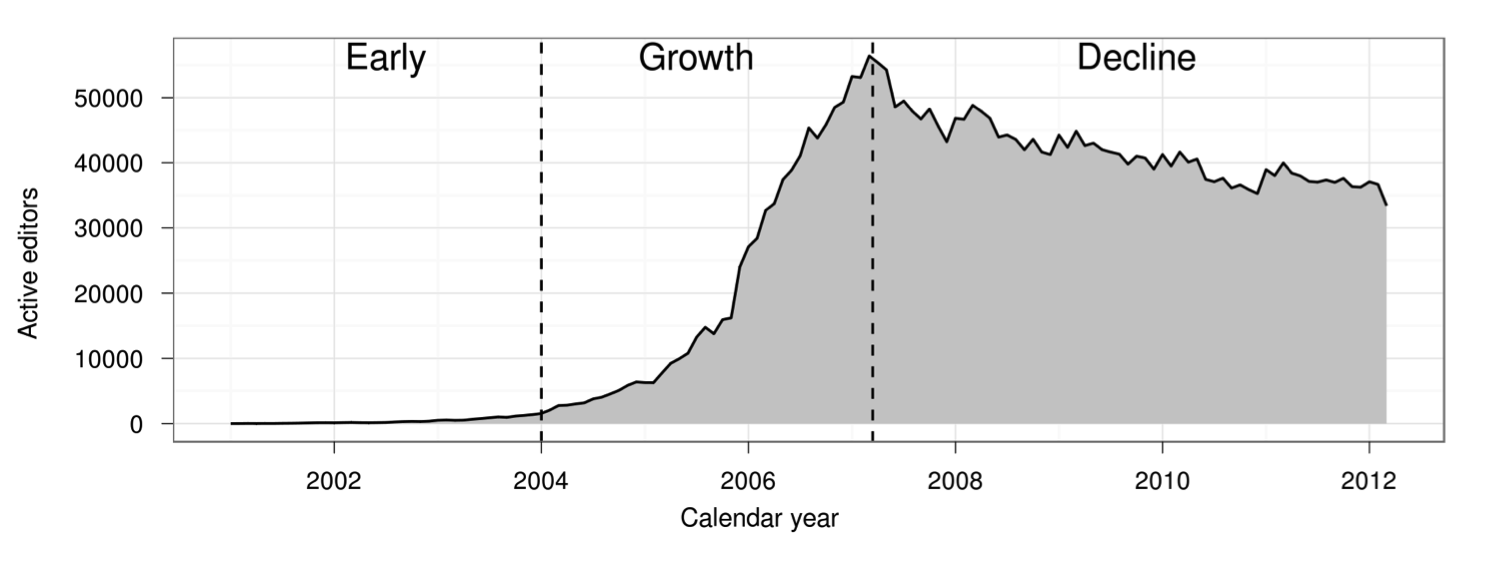
This graph shows the number of people contributing to Wikipedia over time:

The Rise and Decline of Wikipedia The number of active Wikipedia contributors exploded, suddenly stalled, and then began gradually declining. (Figure taken from Halfaker et al. 2013)

The figure comes from “The Rise and Decline of an Open Collaboration System,” a well-known 2013 paper that argued that Wikipedia’s transition from rapid growth to slow decline in 2007 was driven by an increase in quality control systems. Although many people have treated the paper’s finding as representative of broader patterns in online communities, Wikipedia is a very unusual community in many respects. Do other online communities follow Wikipedia’s pattern of rise and decline? Does increased use of quality control systems coincide with community decline elsewhere?

In a paper that my student Nathan TeBlunthuis is presenting Thursday morning at the Association for Computing Machinery (ACM) Conference on Human Factors in Computing Systems (CHI),  a group of us have replicated and extended the 2013 paper’s analysis in 769 other large wikis. We find that the dynamics observed in Wikipedia are a strikingly good description of the average Wikia wiki. They appear to reoccur again and again in many communities.

The original “Rise and Decline” paper (we’ll abbreviate it “RAD”) was written by Aaron Halfaker, R. Stuart Geiger, Jonathan T. Morgan, and John Riedl. They analyzed data from English Wikipedia and found that Wikipedia’s transition from rise to decline was accompanied by increasing rates of newcomer rejection as well as the growth of bots and algorithmic quality control tools. They also showed that newcomers whose contributions were rejected were less likely to continue editing and that community policies and norms became more difficult to change over time, especially for newer editors.

Our paper, just published in the CHI 2018 proceedings, replicates most of RAD’s analysis on a dataset of 769 of the  largest wikis from Wikia that were active between 2002 to 2010.  We find that RAD’s findings generalize to this large and diverse sample of communities.

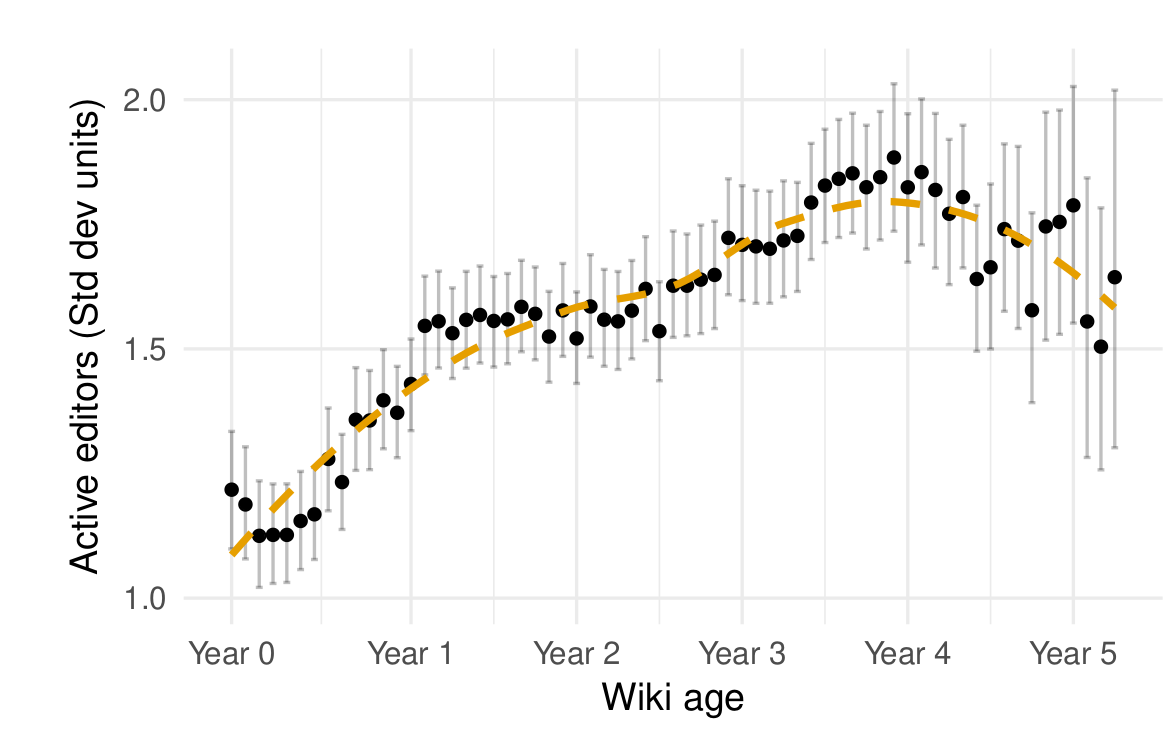
We can walk you through some of the key findings. First, the growth trajectory of the average wiki in our sample is similar to that of English Wikipedia. As shown in the figure below, an initial period of growth stabilizes and leads to decline several years later.

Rise and Decline on Wikia The average Wikia wikia also experience a period of growth followed by stabilization and decline (from TeBlunthuis, Shaw, and Hill 2018).

We also found that newcomers on Wikia wikis were reverted more and continued editing less. As on Wikipedia, the two processes were related. Similar to RAD, we also found that newer editors were more likely to have their contributions to the “project namespace” (where policy pages are located) undone as wikis got older. Indeed, the specific estimates from our statistical models are very similar to RAD’s for most of these findings!

There were some parts of the RAD analysis that we couldn’t reproduce in our context. For example, there are not enough bots or algorithmic editing tools in Wikia to support statistical claims about their effects on newcomers.

At the same time, we were able to do some things that the RAD authors could not.  Most importantly, our findings discount some Wikipedia-specific explanations for a rise and decline. For example, English Wikipedia’s decline coincided with the rise of Facebook, smartphones, and other social media platforms. In theory, any of these factors could have caused the decline. Because the wikis in our sample experienced rises and declines at similar points in their life-cycle but at different points in time, the rise and decline findings we report seem unlikely to be caused by underlying temporal trends.

The big communities we study seem to have consistent “life cycles” where stabilization and/or decay follows an initial period of growth. The fact that the same kinds of patterns happen on English Wikipedia and other online groups implies a more general set of social dynamics at work that we do not think existing research (including ours) explains in a satisfying way. What drives the rise and decline of communities more generally? Our findings make it clear that this is a big, important question that deserves more attention.

We hope you’ll read the paper and get in touch by commenting on this post or emailing Nate if you’d like to learn or talk more. The paper is available online and has been published under an open access license. If you really want to get into the weeds of the analysis, we will soon publish all the data and code necessary to reproduce our work in a repository on the Harvard Dataverse.

Nate TeBlunthuis will be presenting the project this week at CHI in Montréal on Thursday April 26 at 9am in room 517D.  For those of you not familiar with CHI, it is the top venue for Human-Computer Interaction. All CHI submissions go through double-blind peer review and the papers that make it into the proceedings are considered published (same as journal articles in most other scientific fields). Please feel free to cite our paper and send it around to your friends!


This blog post, and the open access paper that it describes, is a collaborative project with Aaron Shaw, that was led by Nate TeBlunthuis. A version of this blog post was originally posted on the Community Data Science Collective blog. Financial support came from the US National Science Foundation (grants IIS-1617129,  IIS-1617468, and GRFP-2016220885 ), Northwestern University, the Center for Advanced Study in the Behavioral Sciences at Stanford University, and the University of Washington. This project was completed using the Hyak high performance computing cluster at the University of Washington.

UW Stationery in LaTeX

The University of Washington’s brand page recently started publishing letterhead templates that departments and faculty can use for official communication. Unfortunately, they only provide them in Microsoft Word DOCX format.

Because my research group works in TeX for everything, Sayamindu Dasgupta and I worked together to create a LaTeX version of the “Matrix Department Signature Template” (the DOCX file is available here). We figured other folks at UW might be interested in it as well.

The best way to get the template to use it yourself is to clone it from the pubic git repository we host (git clone 'https://gitea.communitydata.science/mako/uw_tex_letterhead'). If you notice issues or if you want to create branches with either of the other two types of official UW stationary, patches are always welcome (instructions on how to make and send patches is here)!

Because the template relies on two OpenType fonts, it requires XeTeX. A detailed list of the dependencies is provided in the README file. We’ve only run it on GNU/Linux (Debian and Arch) but it should work well on any operating system that can run XeTeX as well as web-based TeX systems like Overleaf.

And although we created the template, keep in mind that we don’t manage UW’s brand identity in anyway. If you have any questions or concerns about if and when you should use the letterhead, you should contact brand and creative services with the contact information on the stationery page.

Updated: Updated URL as we’ve moved from gitweb/gitdaemon to Gitea. [2025-06-14]

Introducing Computational Methods to Social Media Scientists

The ubiquity of large-scale data and improvements in computational hardware and algorithms have provided enabled researchers to apply computational approaches to the study of human behavior. One of the richest contexts for this kind of work is social media datasets like Facebook, Twitter, and Reddit.

We were invited by Jean BurgessAlice Marwick, and Thomas Poell to write a chapter about computational methods for the Sage Handbook of Social Media. Rather than simply listing what sorts of computational research has been done with social media data, we decided to use the chapter to both introduce a few computational methods and to use those methods in order to analyze the field of social media research.

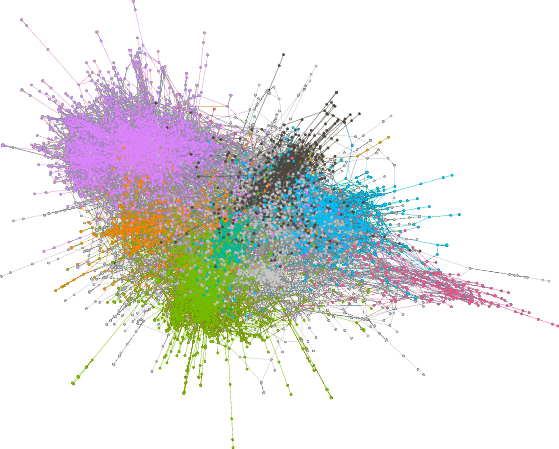
A “hairball” diagram from the chapter illustrating how research on social media clusters into distinct citation network neighborhoods.

Explanations and Examples

In the chapter, we start by describing the process of obtaining data from web APIs and use as a case study our process for obtaining bibliographic data about social media publications from Elsevier’s Scopus API.  We follow this same strategy in discussing social network analysis, topic modeling, and prediction. For each, we discuss some of the benefits and drawbacks of the approach and then provide an example analysis using the bibliographic data.

We think that our analyses provide some interesting insight into the emerging field of social media research. For example, we found that social network analysis and computer science drove much of the early research, while recently consumer analysis and health research have become more prominent.

More importantly though, we hope that the chapter provides an accessible introduction to computational social science and encourages more social scientists to incorporate computational methods in their work, either by gaining computational skills themselves or by partnering with more technical colleagues. While there are dangers and downsides (some of which we discuss in the chapter), we see the use of computational tools as one of the most important and exciting developments in the social sciences.

Steal this paper!

One of the great benefits of computational methods is their transparency and their reproducibility. The entire process—from data collection to data processing to data analysis—can often be made accessible to others. This has both scientific benefits and pedagogical benefits.

To aid in the training of new computational social scientists, and as an example of the benefits of transparency, we worked to make our chapter pedagogically reproducible. We have created a permanent website for the chapter at https://communitydata.science/social-media-chapter/ and uploaded all the code, data, and material we used to produce the paper itself to an archive in the Harvard Dataverse.

Through our website, you can download all of the raw data that we used to create the paper, together with code and instructions for how to obtain, clean, process, and analyze the data. Our website walks through what we have found to be an efficient and useful workflow for doing computational research on large datasets. This workflow even includes the paper itself, which is written using LaTeX + knitr. These tools let changes to data or code propagate through the entire workflow and be reflected automatically in the paper itself.

If you  use our chapter for teaching about computational methods—or if you find bugs or errors in our work—please let us know! We want this chapter to be a useful resource, will happily consider any changes, and have even created a git repository to help with managing these changes!


The book chapter and this blog post were written with Jeremy Foote and Aaron Shaw. You can read the book chapter here. This blog post was originally published on the Community Data Science Collective blog.

OpenSym 2017 Program Postmortem

The International Symposium on Open Collaboration (OpenSym, formerly WikiSym) is the premier academic venue exclusively focused on scholarly research into open collaboration. OpenSym is an ACM conference which means that, like conferences in computer science, it’s really more like a journal that gets published once a year than it is like most social science conferences. The “journal”, in this case, is called the Proceedings of the International Symposium on Open Collaboration and it consists of final copies of papers which are typically also presented at the conference. Like journal articles, papers that are published in the proceedings are not typically published elsewhere.

Along with Claudia Müller-Birn from the Freie Universtät Berlin, I served as the Program Chair for OpenSym 2017. For the social scientists reading this, the role of program chair is similar to being an editor for a journal. My job was not to organize keynotes or logistics at the conference—that is the job of the General Chair. Indeed, in the end I didn’t even attend the conference! Along with Claudia, my role as Program Chair was to recruit submissions, recruit reviewers, coordinate and manage the review process, make final decisions on papers, and ensure that everything makes it into the published proceedings in good shape.

In OpenSym 2017, we made several changes to the way the conference has been run:

  • In previous years, OpenSym had tracks on topics like free/open source software, wikis, open innovation, open education, and so on. In 2017, we used a single track model.
  • Because we eliminated tracks, we also eliminated track-level chairs. Instead, we appointed Associate Chairs or ACs.
  • We eliminated page limits and the distinction between full papers and notes.
  • We allowed authors to write rebuttals before reviews were finalized. Reviewers and ACs were allowed to modify their reviews and decisions based on rebuttals.
  • To assist in assigning papers to ACs and reviewers, we made extensive use of bidding. This means we had to recruit the pool of reviewers before papers were submitted.

Although each of these things have been tried in other conferences, or even piloted within individual tracks in OpenSym, all were new to OpenSym in general.

Overview

Statistics
Papers submitted 44
Papers accepted 20
Acceptance rate 45%
Posters submitted 2
Posters presented 9
Associate Chairs 8
PC Members 59
Authors 108
Author countries 20

The program was similar in size to the ones in the last 2-3 years in terms of the number of submissions. OpenSym is a small but mature and stable venue for research on open collaboration. This year was also similar, although slightly more competitive, in terms of the conference acceptance rate (45%—it had been slightly above 50% in previous years).

As in recent years, there were more posters presented than submitted because the PC found that some rejected work, although not ready to be published in the proceedings, was promising and advanced enough to be presented as a poster at the conference. Authors of posters submitted 4-page extended abstracts for their projects which were published in a “Companion to the Proceedings.”

Topics

Over the years, OpenSym has established a clear set of niches. Although we eliminated tracks, we asked authors to choose from a set of categories when submitting their work. These categories are similar to the tracks at OpenSym 2016. Interestingly, a number of authors selected more than one category. This would have led to difficult decisions in the old track-based system.
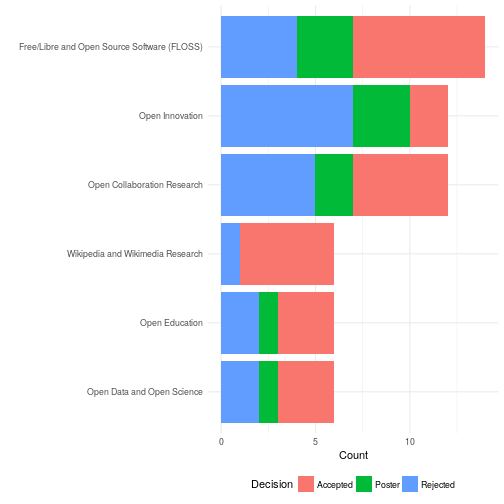
distribution of papers across topics with breakdown by accept/poster/reject

The figure above shows a breakdown of papers in terms of these categories as well as indicators of how many papers in each group were accepted. Papers in multiple categories are counted multiple times. Research on FLOSS and Wikimedia/Wikipedia continue to make up a sizable chunk of OpenSym’s submissions and publications. That said, these now make up a minority of total submissions. Although Wikipedia and Wikimedia research made up a smaller proportion of the submission pool, it was accepted at a higher rate. Also notable is the fact that 2017 saw an uptick in the number of papers on open innovation. I suspect this was due, at least in part, to work by the General Chair Lorraine Morgan’s involvement (she specializes in that area). Somewhat surprisingly to me, we had a number of submission about Bitcoin and blockchains. These are natural areas of growth for OpenSym but have never been a big part of work in our community in the past.

Scores and Reviews

As in previous years, review was single blind in that reviewers’ identities are hidden but authors identities are not. Each paper received between 3 and 4 reviews plus a metareview by the Associate Chair assigned to the paper. All papers received 3 reviews but ACs were encouraged to call in a 4th reviewer at any point in the process. In addition to the text of the reviews, we used a -3 to +3 scoring system where papers that are seen as borderline will be scored as 0. Reviewers scored papers using full-point increments.
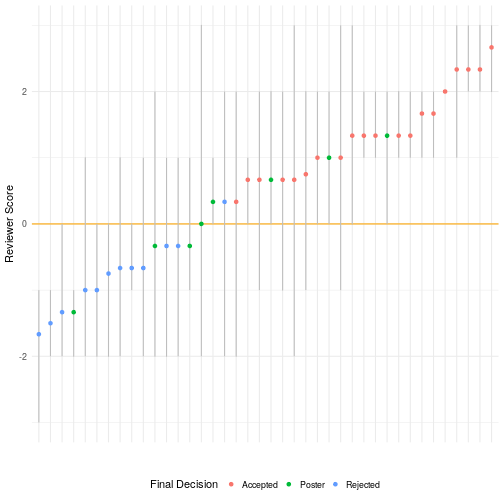
scores for each paper submitted to opensym 2017: average, distribution, etc

The figure above shows scores for each paper submitted. The vertical grey lines reflect the distribution of scores where the minimum and maximum scores for each paper are the ends of the lines. The colored dots show the arithmetic mean for each score (unweighted by reviewer confidence). Colors show whether the papers were accepted, rejected, or presented as a poster. It’s important to keep in mind that two papers were submitted as posters.

Although Associate Chairs made the final decisions on a case-by-case basis, every paper that had an average score of less than 0 (the horizontal orange line) was rejected or presented as a poster and most (but not all) papers with positive average scores were accepted. Although a positive average score seemed to be a requirement for publication, negative individual scores weren’t necessary showstoppers. We accepted 6 papers with at least one negative score. We ultimately accepted 20 papers—45% of those submitted.

Rebuttals

This was the first time that OpenSym used a rebuttal or author response and we are thrilled with how it went. Although they were entirely optional, almost every team of authors used it! Authors of 40 of our 46 submissions (87%!) submitted rebuttals.

Lower Unchanged Higher
6 24 10

The table above shows how average scores changed after authors submitted rebuttals. The table shows that rebuttals’ effect was typically neutral or positive. Most average scores stayed the same but nearly two times as many average scores increased as decreased in the post-rebuttal period. We hope that this made the process feel more fair for authors and I feel, having read them all, that it led to improvements in the quality of final papers.

Page Lengths

In previous years, OpenSym followed most other venues in computer science by allowing submission of two kinds of papers: full papers which could be up to 10 pages long and short papers which could be up to 4. Following some other conferences, we eliminated page limits altogether. This is the text we used in the OpenSym 2017 CFP:

There is no minimum or maximum length for submitted papers. Rather, reviewers will be instructed to weigh the contribution of a paper relative to its length. Papers should report research thoroughly but succinctly: brevity is a virtue. A typical length of a “long research paper” is 10 pages (formerly the maximum length limit and the limit on OpenSym tracks), but may be shorter if the contribution can be described and supported in fewer pages— shorter, more focused papers (called “short research papers” previously) are encouraged and will be reviewed like any other paper. While we will review papers longer than 10 pages, the contribution must warrant the extra length. Reviewers will be instructed to reject papers whose length is incommensurate with the size of their contribution.

The following graph shows the distribution of page lengths across papers in our final program.
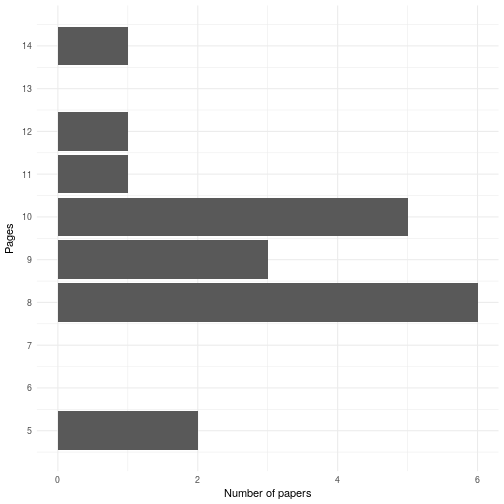
histogram of paper lengths for final accepted papersIn the end 3 of 20 published papers (15%) were over 10 pages. More surprisingly, 11 of the accepted papers (55%) were below the old 10-page limit. Fears that some have expressed that page limits are the only thing keeping OpenSym from publshing enormous rambling manuscripts seems to be unwarranted—at least so far.

Bidding

Although, I won’t post any analysis or graphs, bidding worked well. With only two exceptions, every single assigned review was to someone who had bid “yes” or “maybe” for the paper in question and the vast majority went to people that had bid “yes.” However, this comes with one major proviso: people that did not bid at all were marked as “maybe” for every single paper.

Given a reviewer pool whose diversity of expertise matches that in your pool of authors, bidding works fantastically. But everybody needs to bid. The only problems with reviewers we had were with people that had failed to bid. It might be reviewers who don’t bid are less committed to the conference, more overextended, more likely to drop things in general, etc. It might also be that reviewers who fail to bid get poor matches which cause them to become less interested, willing, or able to do their reviews well and on time.

Having used bidding twice as chair or track-chair, my sense is that bidding is a fantastic thing to incorporate into any conference review process. The major limitations are that you need to build a program committee (PC) before the conference (rather than finding the perfect reviewers for specific papers) and you have to find ways to incentivize or communicate the importance of getting your PC members to bid.

Conclusions

The final results were a fantastic collection of published papers. Of course, it couldn’t have been possible without the huge collection of conference chairs, associate chairs, program committee members, external reviewers, and staff supporters.

Although we tried quite a lot of new things, my sense is that nothing we changed made things worse and many changes made things smoother or better. Although I’m not directly involved in organizing OpenSym 2018, I am on the OpenSym steering committee. My sense is that most of the changes we made are going to be carried over this year.

Finally, it’s also been announced that OpenSym 2018 will be in Paris on August 22-24. The call for papers should be out soon and the OpenSym 2018 paper deadline has already been announced as March 15, 2018. You should consider submitting! I hope to see you in Paris!

This Analysis

OpenSym used the gratis version of EasyChair to manage the conference which doesn’t allow chairs to export data. As a result, data used in this this postmortem was scraped from EasyChair using two Python scripts. Numbers and graphs were created using a knitr file that combines R visualization and analysis code with markdown to create the HTML directly from the datasets. I’ve made all the code I used to produce this analysis available in this git repository. I hope someone else finds it useful. Because the data contains sensitive information on the review process, I’m not publishing the data.


This blog post was originally posted on the Community Data Science Collective blog.
Testing Our Theories About “Eternal September”

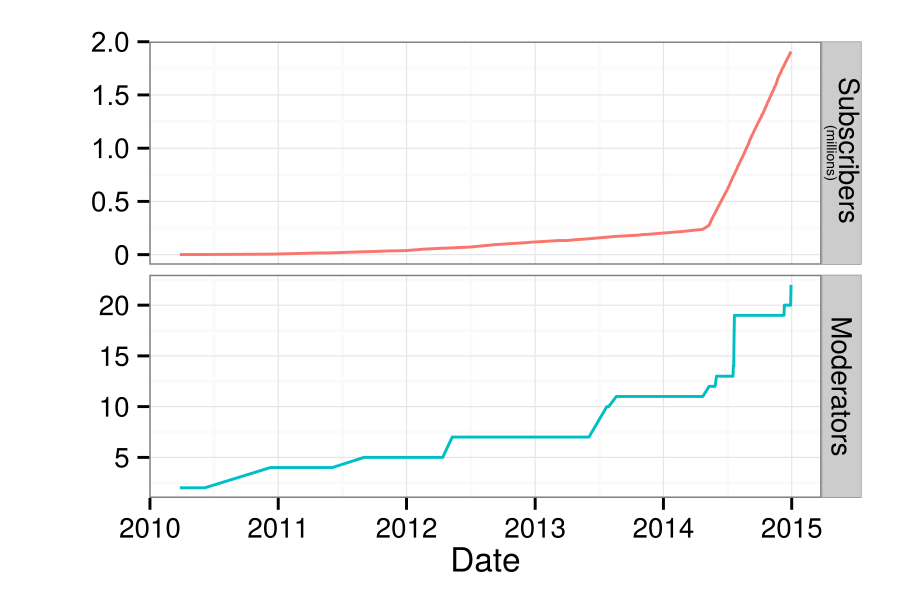
Graph of subscribers and moderators over time in /r/NoSleep. The image is taken from our 2016 CHI paper.

Last year at CHI 2016, my research group published a qualitative study examining the effects of a large influx of newcomers to the /r/nosleep online community in Reddit. Our study began with the observation that most research on sustained waves of newcomers focuses on the destructive effect of newcomers and frequently invokes Usenet’s infamous “Eternal September.” Our qualitative study argued that the /r/nosleep community managed its surge of newcomers gracefully through strategic preparation by moderators, technological systems to reign in on norm violations, and a shared sense of protecting the community’s immersive environment among participants.

We are thrilled that, less a year after the publication of our study, Zhiyuan “Jerry” Lin and a group of researchers at Stanford have published a quantitative test of our study’s findings! Lin analyzed 45 million comments and upvote patterns from 10 Reddit communities that a massive inundation of newcomers like the one we studied on /r/nosleep. Lin’s group found that these communities retained their quality despite a slight dip in its initial growth period.

Our team discussed doing a quantitative study like Lin’s at some length and our paper ends with a lament that our findings merely reflected, “propositions for testing in future work.” Lin’s study provides exactly such a test! Lin et al.’s results suggest that our qualitative findings generalize and that sustained influx of newcomers need not doom a community to a descent into an “Eternal September.” Through strong moderation and the use of a voting system, the subreddits analyzed by Lin appear to retain their identities despite the surge of new users.

There are always limits to research projects work—quantitative and qualitative. We think the Lin’s paper compliments ours beautifully, we are excited that Lin built on our work, and we’re thrilled that our propositions seem to have held up!

This blog post was written with Charlie Kiene. Our paper about /r/nosleep, written with Charlie Kiene and Andrés Monroy-Hernández, was published in the Proceedings of CHI 2016 and is released as open access. Lin’s paper was published in the Proceedings of ICWSM 2017 and is also available online.

Learning to Code in One’s Own Language

I recently published a paper with Sayamindu Dasgupta that provides evidence in support of the idea that kids can learn to code more quickly when they are programming in their own language.

Millions of young people from around the world are learning to code. Often, during their learning experiences, these youth are using visual block-based programming languages like Scratch, App Inventor, and Code.org Studio. In block-based programming languages, coders manipulate visual, snap-together blocks that represent code constructs instead of textual symbols and commands that are found in more traditional programming languages.

The textual symbols used in nearly all non-block-based programming languages are drawn from English—consider “if” statements and “for” loops for common examples. Keywords in block-based languages, on the other hand, are often translated into different human languages. For example, depending on the language preference of the user, an identical set of computing instructions in Scratch can be represented in many different human languages:

Examples of a short piece of Scratch code shown in four different human languages: English, Italian, Norwegian Bokmål, and German.

Although my research with Sayamindu Dasgupta focuses on learning, both Sayamindu and I worked on local language technologies before coming back to academia. As a result, we were both interested in how the increasing translation of programming languages might be making it easier for non-English speaking kids to learn to code.

After all, a large body of education research has shown that early-stage education is more effective when instruction is in the language that the learner speaks at home. Based on this research, we hypothesized that children learning to code with block-based programming languages translated to their mother-tongues will have better learning outcomes than children using the blocks in English.

We sought to test this hypothesis in Scratch, an informal learning community built around a block-based programming language. We were helped by the fact that Scratch is translated into many languages and has a large number of learners from around the world.

To measure learning, we built on some of our our own previous work and looked at learners’ cumulative block repertoires—similar to a code vocabulary. By observing a learner’s cumulative block repertoire over time, we can measure how quickly their code vocabulary is growing.

Using this data, we compared the rate of growth of cumulative block repertoire between learners from non-English speaking countries using Scratch in English to learners from the same countries using Scratch in their local language. To identify non-English speakers, we considered Scratch users who reported themselves as coming from five primarily non-English speaking countries: Portugal, Italy, Brazil, Germany, and Norway. We chose these five countries because they each have one very widely spoken language that is not English and because Scratch is almost fully translated into that language.

Even after controlling for a number of factors like social engagement on the Scratch website, user productivity, and time spent on projects, we found that learners from these countries who use Scratch in their local language have a higher rate of cumulative block repertoire growth than their counterparts using Scratch in English. This faster growth was despite having a lower initial block repertoire. The graph below visualizes our results for two “prototypical” learners who start with the same initial block repertoire: one learner who uses the English interface, and a second learner who uses their native language.

Summary of the results of our model for two prototypical individuals.

Our results are in line with what theories of education have to say about learning in one’s own language. Our findings also represent good news for designers of block-based programming languages who have spent considerable amounts of effort in making their programming languages translatable. It’s also good news for the volunteers who have spent many hours translating blocks and user interfaces.

Although we find support for our hypothesis, we should stress that our findings are both limited and incomplete. For example, because we focus on estimating the differences between Scratch learners, our comparisons are between kids who all managed to successfully use Scratch. Before Scratch was translated, kids with little working knowledge of English or the Latin script might not have been able to use Scratch at all. Because of translation, many of these children are now able to learn to code.


This blog post and the work that it describes is a collaborative project with Sayamindu Dasgupta. Sayamindu also published a very similar version of the blog post in several places. Our paper is open access and you can read it here. The paper was published in the proceedings of the ACM Learning @ Scale Conference. We also recently gave a talk about this work at the International Communication Association’s annual conference. We received support and feedback from members of the Scratch team at MIT (especially Mitch Resnick and Natalie Rusk), as well as from Nathan TeBlunthuis at the University of Washington. Financial support came from the US National Science Foundation.

The Community Data Science Collective Dataverse

I’m pleased to announce the Community Data Science Collective Dataverse. Our dataverse is an archival repository for datasets created by the Community Data Science Collective. The dataverse won’t replace work that collective members have been doing for years to document and distribute data from our research. What we hope it will do is get our data — like our published manuscripts — into the hands of folks in the “forever” business.

Over the past few years, the Community Data Science Collective has published several papers where an important part of the contribution is a dataset. These include:

Recently, we’ve also begun producing replication datasets to go alongside our empirical papers. So far, this includes:

In the case of each of the first groups of papers where the dataset was a part of the contribution, we uploaded code and data to a website we’ve created. Of course, even if we do a wonderful job of keeping these websites maintained over time, eventually, our research group will cease to exist. When that happens, the data will eventually disappear as well.

The text of our papers will be maintained long after we’re gone in the journal or conference proceedings’ publisher’s archival storage and in our universities’ institutional archives. But what about the data? Since the data is a core part — perhaps the core part — of the contribution of these papers, the data should be archived permanently as well.

Toward that end, our group has created a dataverse. Our dataverse is a repository within the Harvard Dataverse where we have been uploading archival copies of datasets over the last six months. All five of the papers described above are uploaded already. The Scratch dataset, due to access control restrictions, isn’t listed on the main page but it’s online on the site. Moving forward, we’ll be populating this new datasets we create as well as replication datasets for our future empirical papers. We’re currently preparing several more.

The primary point of the CDSC Dataverse is not to provide you with way to get our data although you’re certainly welcome to use it that way and it might help make some of it more discoverable. The websites we’ve created (like for the ones for redirects and for page protection) will continue to exist and be maintained. The Dataverse is insurance for if, and when, those websites go down to ensure that our data will still be accessible.


This post was also published on the Community Data Science Collective blog.

The Wikipedia Adventure

I recently finished a paper that presents a novel social computing system called the Wikipedia Adventure. The system was a gamified tutorial for new Wikipedia editors. Working with the tutorial creators, we conducted both a survey of its users and a randomized field experiment testing its effectiveness in encouraging subsequent contributions. We found that although users loved it, it did not affect subsequent participation rates.

Start screen for the Wikipedia Adventure.

A major concern that many online communities face is how to attract and retain new contributors. Despite it’s success, Wikipedia is no different. In fact, researchers have shown that after experiencing a massive initial surge in activity, the number of active editors on Wikipedia has been in slow decline since 2007.

The number of active, registered editors (≥5 edits per month) to Wikipedia over time. From Halfaker, Geiger, and Morgan 2012.

Research has attributed a large part of this decline to the hostile environment that newcomers experience when begin contributing. New editors often attempt to make contributions which are subsequently reverted by more experienced editors for not following Wikipedia’s increasingly long list of rules and guidelines for effective participation.

This problem has led many researchers and Wikipedians to wonder how to more effectively onboard newcomers to the community. How do you ensure that new editors Wikipedia quickly gain the knowledge they need in order to make contributions that are in line with community norms?

To this end, Jake Orlowitz and Jonathan Morgan from the Wikimedia Foundation worked with a team of Wikipedians to create a structured, interactive tutorial called The Wikipedia Adventure. The idea behind this system was that new editors would be invited to use it shortly after creating a new account on Wikipedia, and it would provide a step-by-step overview of the basics of editing.

The Wikipedia Adventure was designed to address issues that new editors frequently encountered while learning how to contribute to Wikipedia. It is structured into different ‘missions’ that guide users through various aspects of participation on Wikipedia, including how to communicate with other editors, how to cite sources, and how to ensure that edits present a neutral point of view. The sequence of the missions gives newbies an overview of what they need to know instead of having to figure everything out themselves. Additionally, the theme and tone of the tutorial sought to engage new users, rather than just redirecting them to the troves of policy pages.

Those who play the tutorial receive automated badges on their user page for every mission they complete. This signals to veteran editors that the user is acting in good-faith by attempting to learn the norms of Wikipedia.

An example of a badge that a user receives after demonstrating the skills to communicate with other users on Wikipedia.

Once the system was built, we were interested in knowing whether people enjoyed using it and found it helpful. So we conducted a survey asking editors who played the Wikipedia Adventure a number of questions about its design and educational effectiveness. Overall, we found that users had a very favorable opinion of the system and found it useful.

Survey responses about how users felt about TWA.

Survey responses about what users learned through TWA.

We were heartened by these results. We’d sought to build an orientation system that was engaging and educational, and our survey responses suggested that we succeeded on that front. This led us to ask the question – could an intervention like the Wikipedia Adventure help reverse the trend of a declining editor base on Wikipedia? In particular, would exposing new editors to the Wikipedia Adventure lead them to make more contributions to the community?

To find out, we conducted a field experiment on a population of new editors on Wikipedia. We identified 1,967 newly created accounts that passed a basic test of making good-faith edits. We then randomly invited 1,751 of these users via their talk page to play the Wikipedia Adventure. The rest were sent no invitation. Out of those who were invited, 386 completed at least some portion of the tutorial.

We were interested in knowing whether those we invited to play the tutorial (our treatment group) and those we didn’t (our control group) contributed differently in the first six months after they created accounts on Wikipedia. Specifically, we wanted to know whether there was a difference in the total number of edits they made to Wikipedia, the number of edits they made to talk pages, and the average quality of their edits as measured by content persistence.

We conducted two kinds of analyses on our dataset. First, we estimated the effect of inviting users to play the Wikipedia Adventure on our three outcomes of interest. Second, we estimated the effect of playing the Wikipedia Adventure, conditional on having been invited to do so, on those same outcomes.

To our surprise, we found that in both cases there were no significant effects on any of the outcomes of interest. Being invited to play the Wikipedia Adventure therefore had no effect on new users’ volume of participation either on Wikipedia in general, or on talk pages specifically, nor did it have any effect on the average quality of edits made by the users in our study. Despite the very positive feedback that the system received in the survey evaluation stage, it did not produce a significant change in newcomer contribution behavior. We concluded that the system by itself could not reverse the trend of newcomer attrition on Wikipedia.

Why would a system that was received so positively ultimately produce no aggregate effect on newcomer participation? We’ve identified a few possible reasons. One is that perhaps a tutorial by itself would not be sufficient to counter hostile behavior that newcomers might experience from experienced editors. Indeed, the friendly, welcoming tone of the Wikipedia Adventure might contrast with strongly worded messages that new editors receive from veteran editors or bots. Another explanation might be that users enjoyed playing the Wikipedia Adventure, but did not enjoy editing Wikipedia. After all, the two activities draw on different kinds of motivations. Finally, the system required new users to choose to play the tutorial. Maybe people who chose to play would have gone on to edit in similar ways without the tutorial.

Ultimately, this work shows us the importance of testing systems outside of lab studies. The Wikipedia Adventure was built by community members to address known gaps in the onboarding process, and our survey showed that users responded well to its design.

While it would have been easy to declare victory at that stage, the field deployment study painted a different picture. Systems like the Wikipedia Adventure may inform the design of future orientation systems. That said, more profound changes to the interface or modes of interaction between editors might also be needed to increase contributions from newcomers.

This blog post, and the open access paper that it describes, is a collaborative project with Sneha Narayan, Jake OrlowitzJonathan Morgan, and Aaron Shaw. Financial support came from the US National Science Foundation (grants IIS-1617129 and IIS-1617468), Northwestern University, and the University of Washington. We also published all the data and code necessary to reproduce our analysis in a repository in the Harvard Dataverse. Sneha posted the material in this blog post over on the Community Data Science Collective Blog.

Children’s Perspectives on Critical Data Literacies

Last week, we presented a new paper that describes how children are thinking through some of the implications of new forms of data collection and analysis. The presentation was given at the ACM CHI conference in Denver last week and the paper is open access and online.

Over the last couple years, we’ve worked on a large project to support children in doing — and not just learning about — data science. We built a system, Scratch Community Blocks, that allows the 18 million users of the Scratch online community to write their own computer programs — in Scratch of course — to analyze data about their own learning and social interactions. An example of one of those programs to find how many of one’s follower in Scratch are not from the United States is shown below.

Last year, we deployed Scratch Community Blocks to 2,500 active Scratch users who, over a period of several months, used the system to create more than 1,600 projects.

As children used the system, Samantha Hautea, a student in UW’s Communication Leadership program, led a group of us in an online ethnography. We visited the projects children were creating and sharing. We followed the forums where users discussed the blocks. We read comment threads left on projects. We combined Samantha’s detailed field notes with the text of comments and forum posts, with ethnographic interviews of several users, and with notes from two in-person workshops. We used a technique called grounded theory to analyze these data.

What we found surprised us. We expected children to reflect on being challenged by — and hopefully overcoming — the technical parts of doing data science. Although we certainly saw this happen, what emerged much more strongly from our analysis was detailed discussion among children about the social implications of data collection and analysis.

In our analysis, we grouped children’s comments into five major themes that represented what we called “critical data literacies.” These literacies reflect things that children felt were important implications of social media data collection and analysis.

First, children reflected on the way that programmatic access to data — even data that was technically public — introduced privacy concerns. One user described the ability to analyze data as, “creepy”, but at the same time, “very cool.” Children expressed concern that programmatic access to data could lead to “stalking“ and suggested that the system should ask for permission.

Second, children recognized that data analysis requires skepticism and interpretation. For example, Scratch Community Blocks introduced a bug where the block that returned data about followers included users with disabled accounts. One user, in an interview described to us how he managed to figure out the inconsistency:

At one point the follower blocks, it said I have slightly more followers than I do. And, that was kind of confusing when I was trying to make the project. […] I pulled up a second [browser] tab and compared the [data from Scratch Community Blocks and the data in my profile].

Third, children discussed the hidden assumptions and decisions that drive the construction of metrics. For example, the number of views received for each project in Scratch is counted using an algorithm that tries to minimize the impact of gaming the system (similar to, for example, Youtube). As children started to build programs with data, they started to uncover and speculate about the decisions behind metrics. For example, they guessed that the view count might only include “unique” views and that view counts may include users who do not have accounts on the website.

Fourth, children building projects with Scratch Community Blocks realized that an algorithm driven by social data may cause certain users to be excluded. For example, a 13-year-old expressed concern that the system could be used to exclude users with few social connections saying:

I love these new Scratch Blocks! However I did notice that they could be used to exclude new Scratchers or Scratchers with not a lot of followers by using a code: like this:
when flag clicked
if then user’s followers < 300
stop all.
I do not think this a big problem as it would be easy to remove this code but I did just want to bring this to your attention in case this not what you would want the blocks to be used for.

Fifth, children were concerned about the possibility that measurement might distort the Scratch community’s values. While giving feedback on the new system, a user expressed concern that by making it easier to measure and compare followers, the system could elevate popularity over creativity, collaboration, and respect as a marker of success in Scratch.

I think this was a great idea! I am just a bit worried that people will make these projects and take it the wrong way, saying that followers are the most important thing in on Scratch.

Kids’ conversations around Scratch Community Blocks are good news for educators who are starting to think about how to engage young learners in thinking critically about the implications of data. Although no kid using Scratch Community Blocks discussed each of the five literacies described above, the themes reflect starting points for educators designing ways to engage kids in thinking critically about data.

Our work shows that if children are given opportunities to actively engage and build with social and behavioral data, they might not only learn how to do data analysis, but also reflect on its implications.

This blog-post and the work that it describes is a collaborative project by Samantha Hautea, Sayamindu Dasgupta, and Benjamin Mako Hill. We have also received support and feedback from members of the Scratch team at MIT (especially Mitch Resnick and Natalie Rusk), as well as from Hal Abelson from MIT CSAIL. Financial support came from the US National Science Foundation.

Surviving an “Eternal September:” How an Online Community Managed a Surge of Newcomers

Attracting newcomers is among the most widely studied problems in online community research. However, with all the attention paid to challenge of getting new users, much less research has studied the flip side of that coin: large influxes of newcomers can pose major problems as well!

The most widely known example of problems caused by an influx of newcomers into an online community occurred in Usenet. Every September, new university students connecting to the Internet for the first time would wreak havoc in the Usenet discussion forums. When AOL connected its users to the Usenet in 1994, it disrupted the community for so long that it became widely known as “The September that never ended”.

Our study considered a similar influx in NoSleep—an online community within Reddit where writers share original horror stories and readers comment and vote on them. With strict rules requiring that all members of the community suspend disbelief, NoSleep thrives off the fact that readers experience an immersive storytelling environment. Breaking the rules is as easy as questioning the truth of someone’s story. Socializing newcomers represents a major challenge for NoSleep.

Number of subscribers and moderators on /r/NoSleep over time.

On May 7th, 2014, NoSleep became a “default subreddit”—i.e., every new user to Reddit automatically joined NoSleep. After gradually accumulating roughly 240,000 members from 2010 to 2014, the NoSleep community grew to over 2 million subscribers in a year. That said, NoSleep appeared to largely hold things together. This reflects the major question that motivated our study: How did NoSleep withstand such a massive influx of newcomers without enduring their own Eternal September?

To answer this question, we interviewed a number of NoSleep participants, writers, moderators, and admins. After transcribing, coding, and analyzing the results, we proposed that NoSleep survived because of three inter-connected systems that helped protect the community’s norms and overall immersive environment.

First, there was a strong and organized team of moderators who enforced the rules no matter what. They recruited new moderators knowing the community’s population was going to surge. They utilized a private subreddit for NoSleep’s staff. They were able to socialize and educate new moderators effectively. Although issuing sanctions against community members was often difficult, our interviewees explained that NoSleep’s moderators were deeply committed and largely uncompromising.

That commitment resonates within the second system that protected NoSleep: regulation by normal community members. From our interviews, we found that the participants felt a shared sense of community that motivated them both to socialize newcomers themselves as well as to report inappropriate comments and downvote people who violate the community’s norms.

Finally, we found that the technological systems protected the community as well. For instance, post-throttling was instituted to limit the frequency at which a writer could post their stories. Additionally, Reddit’s “Automoderator”, a programmable AI bot, was used to issue sanctions against obvious norm violators while running in the background. Participants also pointed to the tools available to them—the report feature and voting system in particular—to explain how easy it was for them to report and regulate the community’s disruptors.

This blog post was written with Charlie Kiene. The paper and work this post describes is collaborative work with Charlie Kiene and Andrés Monroy-Hernández. The paper was published in the Proceedings of CHI 2016 and is released as open access so anyone can read the entire paper here. A version of this post was published on the Community Data Science Collective blog.
New Dataset: Five Years of Longitudinal Data from Scratch

Scratch is a block-based programming language created by the Lifelong Kindergarten Group (LLK) at the MIT Media Lab. Scratch gives kids the power to use programming to create their own interactive animations and computer games. Since 2007, the online community that allows Scratch programmers to share, remix, and socialize around their projects has drawn more than 16 million users who have shared nearly 20 million projects and more than 100 million comments. It is one of the most popular ways for kids to learn programming and among the larger online communities for kids in general.

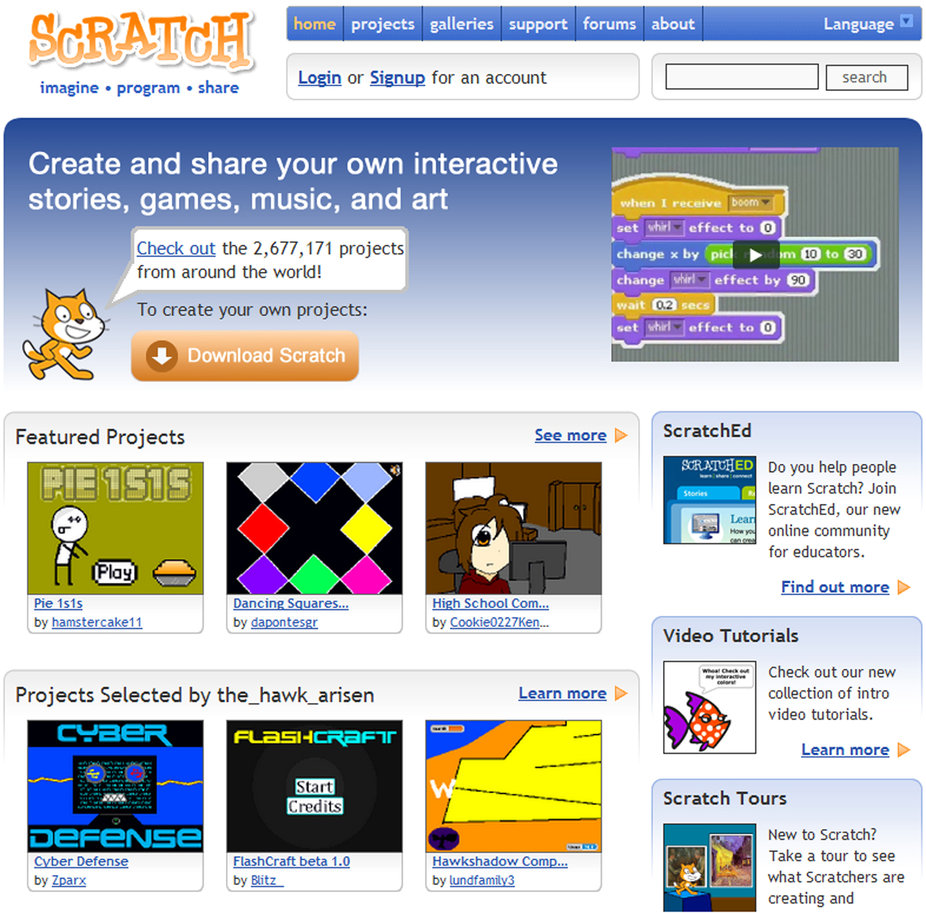
Front page of the Scratch online community (https://scratch.mit.edu) during the period covered by the dataset.

Since 2010, I have published a series of papers using quantitative data collected from the database behind the Scratch online community. As the source of data for many of my first quantitative and data scientific papers, it’s not a major exaggeration to say that I have built my academic career on the dataset.

I was able to do this work because I happened to be doing my masters in a research group that shared a physical space (“The Cube”) with LLK and because I was friends with Andrés Monroy-Hernández, who started in my masters cohort at the Media Lab. A year or so after we met, Andrés conceived of the Scratch online community and created the first version for his masters thesis project. Because I was at MIT and because I knew the right people, I was able to get added to the IRB protocols and jump through the hoops necessary to get access to the database.

Over the years, Andrés and I have heard over and over, in conversation and in reviews of our papers, that we were privileged to have access to such a rich dataset. More than three years ago, Andrés and I began trying to figure out how we might broaden this access. Andrés had the idea of taking advantage of the launch of Scratch 2.0 in 2013 to focus on trying to release the first five years of Scratch 1.x online community data (March 2007 through March 2012) — most of the period that the codebase he had written ran the site.

After more work than I have put into any single research paper or project, Andrés and I have published a data descriptor in Nature’s new journal Scientific Data. This means that the data is now accessible to other researchers. The data includes five years of detailed longitudinal data organized in 32 tables with information drawn from more than 1 million Scratch users, nearly 2 million Scratch projects, more than 10 million comments, more than 30 million visits to Scratch projects, and much more. The dataset includes metadata on user behavior as well the full source code for every project. Alongside the data is the source code for all of the software that ran the website and that users used to create the projects as well as the code used to produce the dataset we’ve released.

Releasing the dataset was a complicated process. First, we had navigate important ethical concerns about the the impact that a release of any data might have on Scratch’s users. Toward that end, we worked closely with the Scratch team and the the ethics board at MIT to design a protocol for the release that balanced these risks with the benefit of a release. The most important features of our approach in this regard is that the dataset we’re releasing is limited to only public data. Although the data is public, we understand that computational access to data is different in important ways to access via a browser or API. As a result, we’re requiring anybody interested in the data to tell us who they are and agree to a detailed usage agreement. The Scratch team will vet these applicants. Although we’re worried that this creates a barrier to access, we think this approach strikes a reasonable balance.

Beyond the the social and ethical issues, creating the dataset was an enormous task. Andrés and I spent Sunday afternoons over much of the last three years going column-by-column through the MySQL database that ran Scratch. We looked through the source code and the version control system to figure out how the data was created. We spent an enormous amount of time trying to figure out which columns and rows were public. Most of our work went into creating detailed codebooks and documentation that we hope makes the process of using this data much easier for others (the data descriptor is just a brief overview of what’s available). Serializing some of the larger tables took days of computer time.

In this process, we had a huge amount of help from many others including an enormous amount of time and support from Mitch Resnick, Natalie Rusk, Sayamindu Dasgupta, and Benjamin Berg at MIT as well as from many other on the Scratch Team. We also had an enormous amount of feedback from a group of a couple dozen researchers who tested the release as well as others who helped us work through through the technical, social, and ethical challenges. The National Science Foundation funded both my work on the project and the creation of Scratch itself.

Because access to data has been limited, there has been less research on Scratch than the importance of the system warrants. We hope our work will change this. We can imagine studies using the dataset by scholars in communication, computer science, education, sociology, network science, and beyond. We’re hoping that by opening up this dataset to others, scholars with different interests, different questions, and in different fields can benefit in the way that Andrés and I have. I suspect that there are other careers waiting to be made with this dataset and I’m excited by the prospect of watching those careers develop.

You can find out more about the dataset, and how to apply for access, by reading the data descriptor on Nature’s website.

Supporting children in doing data science

As children use digital media to learn and socialize, others are collecting and analyzing data about these activities. In school and at play, these children find that they are the subjects of data science. As believers in the power of data analysis, we believe that this approach falls short of data science’s potential to promote innovation, learning, and power.

Motivated by this fact, we have been working over the last three years as part of a team at the MIT Media Lab and the University of Washington to design and build a system that attempts to support an alternative vision: children as data scientists. The system we have built is described in a new paper—Scratch Community Blocks: Supporting Children as Data Scientists—that will be published in the proceedings of CHI 2017.

Our system is built on top of Scratch, a visual, block-based programming language designed for children and youth. Scratch is also an online community with over 15 million registered members who share their Scratch projects, remix each others’ work, have conversations, provide feedback, bookmark or “love” projects they like, follow other users, and more. Over the last decade, researchers—including us—have used the Scratch online community’s database to study the youth using Scratch. With Scratch Community Blocks, we attempt to put the power to programmatically analyze these data into the hands of the users themselves.

To do so, our new system adds a set of new programming primitives (blocks) to Scratch so that users can access public data from the Scratch website from inside Scratch. Blocks in the new system gives users access to project and user metadata, information about social interaction, and data about what types of code are used in projects. The full palette of blocks to access different categories of data is shown below.

Project metadata

User metadata

Site-wide statistics

The new blocks allow users to programmatically access, filter, and analyze data about their own participation in the community. For example, with the simple script below, we can find whether we have followers in Scratch who report themselves to be from Spain, and what their usernames are.

Simple demonstration of Scratch Community Blocks

In designing the system, we had two primary motivations. First, we wanted to support avenues through which children can engage in curiosity-driven, creative explorations of public Scratch data. Second, we wanted to foster self-reflection with data. As children looked back upon their own participation and coding activity in Scratch through the project they and their peers made, we wanted them to reflect on their own behavior and learning in ways that shaped their future behavior and promoted exploration.

After designing and building the system over 2014 and 2015, we invited a group of active Scratch users to beta test the system in early 2016. Over four months, 700 users created more than 1,600 projects. The diversity and depth of users creativity with the new blocks surprised us. Children created projects that gave the viewer of the project a personalized doughnut-chart visualization of their coding vocabulary on Scratch, rendered the viewer’s number of followers as scoops of ice-cream on a cone, attempted to find whether “love-its” for projects are more common on Scratch than “favorites”, and told users how “talkative” they were by counting the cumulative string-length of project titles and descriptions.

We found that children, rather than making canonical visualizations such as pie-charts or bar-graphs, frequently made information representations that spoke to their own identities and aesthetic sensibilities. A 13-year-old girl had made a virtual doll dress-up game where the player’s ability to buy virtual clothes and accessories for the doll was determined by the level of their activity in the Scratch community. When we asked about her motivation for making such a project, she said:

I was trying to think of something that somebody hadn’t done yet, and I didn’t see that. And also I really like to do art on Scratch and that was a good opportunity to use that and mix the two [art and data] together.

We also found at least some evidence that the system supported self-reflection with data. For example, after seeing a project that showed its viewers a visualization of their past coding vocabulary, a 15-year-old realized that he does not do much programming with the pen-related primitives in Scratch, and wrote in a comment, “epic! looks like we need to use more pen blocks. :D.”

Doughnut visualization

Ice-cream visualization

Data-driven doll dress up

Additionally, we noted that that as children made and interacted with projects made with Scratch Community Blocks, they started to critically think about the implications of data collection and analysis. These conversations are the subject of another paper (also being published in CHI 2017).

In a 1971 article called “Teaching Children to be Mathematicians vs. Teaching About Mathematics”, Seymour Papert argued for the need for children doing mathematics vs. learning about it. He showed how Logo, the programming language he was developing at that time with his colleagues, could offer children a space to use and engage with mathematical ideas in creative and personally motivated ways. This, he argued, enabled children to go beyond knowing about mathematics to “doing” mathematics, as a mathematician would.

Scratch Community Blocks has not yet been launched for all Scratch users and has several important limitations we discuss in the paper. That said, we feel that the projects created by children in our the beta test demonstrate the real potential for children to do data science, and not just know about it, provide data for it, and to have their behavior nudged and shaped by it.

This blog post and the paper it describes are collaborative work with Sayamindu Dasgupta. We have also received support and feedback from members of the Scratch team at MIT (especially Mitch Resnick and Natalie Rusk), as well as from Hal Abelson. Financial support came from the US National Science Foundation. The paper itself is open access so anyone can read the entire paper here. This blog post was also posted on Sayamindu Dasgupta’s blog, on the Community Data Science Collective blog, and in several other places.