The International Symposium on Open Collaboration (OpenSym, formerly WikiSym) is the premier academic venue exclusively focused on scholarly research into open collaboration. OpenSym is an ACM conference which means that, like conferences in computer science, it’s really more like a journal that gets published once a year than it is like most social science conferences. The “journal”, in this case, is called the Proceedings of the International Symposium on Open Collaboration and it consists of final copies of papers which are typically also presented at the conference. Like journal articles, papers that are published in the proceedings are not typically published elsewhere.
Along with Claudia Müller-Birn from the Freie Universtät Berlin, I served as the Program Chair for OpenSym 2017. For the social scientists reading this, the role of program chair is similar to being an editor for a journal. My job was not to organize keynotes or logistics at the conference—that is the job of the General Chair. Indeed, in the end I didn’t even attend the conference! Along with Claudia, my role as Program Chair was to recruit submissions, recruit reviewers, coordinate and manage the review process, make final decisions on papers, and ensure that everything makes it into the published proceedings in good shape.
In OpenSym 2017, we made several changes to the way the conference has been run:
- In previous years, OpenSym had tracks on topics like free/open source software, wikis, open innovation, open education, and so on. In 2017, we used a single track model.
- Because we eliminated tracks, we also eliminated track-level chairs. Instead, we appointed Associate Chairs or ACs.
- We eliminated page limits and the distinction between full papers and notes.
- We allowed authors to write rebuttals before reviews were finalized. Reviewers and ACs were allowed to modify their reviews and decisions based on rebuttals.
- To assist in assigning papers to ACs and reviewers, we made extensive use of bidding. This means we had to recruit the pool of reviewers before papers were submitted.
Although each of these things have been tried in other conferences, or even piloted within individual tracks in OpenSym, all were new to OpenSym in general.
Overview
| Papers submitted |
44 |
| Papers accepted |
20 |
| Acceptance rate |
45% |
| Posters submitted |
2 |
| Posters presented |
9 |
| Associate Chairs |
8 |
| PC Members |
59 |
| Authors |
108 |
| Author countries |
20 |
The program was similar in size to the ones in the last 2-3 years in terms of the number of submissions. OpenSym is a small but mature and stable venue for research on open collaboration. This year was also similar, although slightly more competitive, in terms of the conference acceptance rate (45%—it had been slightly above 50% in previous years).
As in recent years, there were more posters presented than submitted because the PC found that some rejected work, although not ready to be published in the proceedings, was promising and advanced enough to be presented as a poster at the conference. Authors of posters submitted 4-page extended abstracts for their projects which were published in a “Companion to the Proceedings.”
Topics
Over the years, OpenSym has established a clear set of niches. Although we eliminated tracks, we asked authors to choose from a set of categories when submitting their work. These categories are similar to the tracks at OpenSym 2016. Interestingly, a number of authors selected more than one category. This would have led to difficult decisions in the old track-based system.
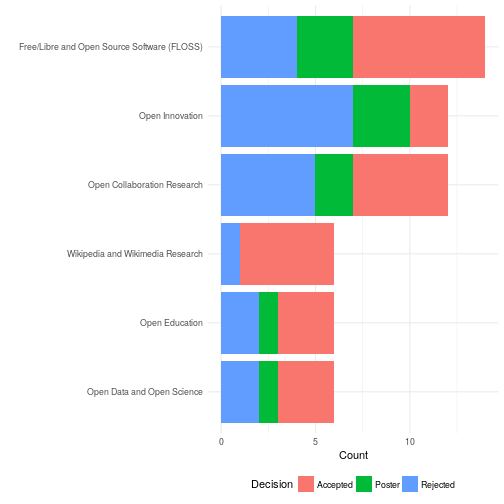
The figure above shows a breakdown of papers in terms of these categories as well as indicators of how many papers in each group were accepted. Papers in multiple categories are counted multiple times. Research on FLOSS and Wikimedia/Wikipedia continue to make up a sizable chunk of OpenSym’s submissions and publications. That said, these now make up a minority of total submissions. Although Wikipedia and Wikimedia research made up a smaller proportion of the submission pool, it was accepted at a higher rate. Also notable is the fact that 2017 saw an uptick in the number of papers on open innovation. I suspect this was due, at least in part, to work by the General Chair Lorraine Morgan’s involvement (she specializes in that area). Somewhat surprisingly to me, we had a number of submission about Bitcoin and blockchains. These are natural areas of growth for OpenSym but have never been a big part of work in our community in the past.
Scores and Reviews
As in previous years, review was single blind in that reviewers’ identities are hidden but authors identities are not. Each paper received between 3 and 4 reviews plus a metareview by the Associate Chair assigned to the paper. All papers received 3 reviews but ACs were encouraged to call in a 4th reviewer at any point in the process. In addition to the text of the reviews, we used a -3 to +3 scoring system where papers that are seen as borderline will be scored as 0. Reviewers scored papers using full-point increments.
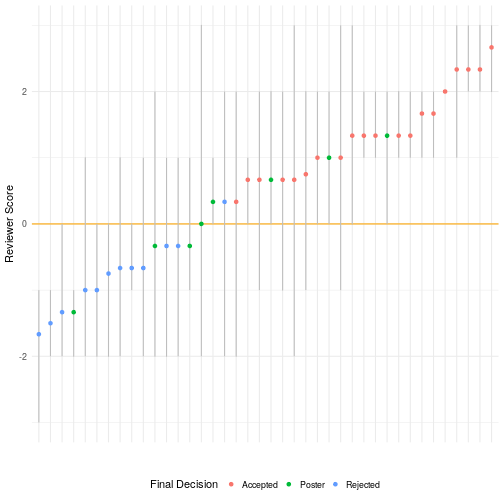
The figure above shows scores for each paper submitted. The vertical grey lines reflect the distribution of scores where the minimum and maximum scores for each paper are the ends of the lines. The colored dots show the arithmetic mean for each score (unweighted by reviewer confidence). Colors show whether the papers were accepted, rejected, or presented as a poster. It’s important to keep in mind that two papers were submitted as posters.
Although Associate Chairs made the final decisions on a case-by-case basis, every paper that had an average score of less than 0 (the horizontal orange line) was rejected or presented as a poster and most (but not all) papers with positive average scores were accepted. Although a positive average score seemed to be a requirement for publication, negative individual scores weren’t necessary showstoppers. We accepted 6 papers with at least one negative score. We ultimately accepted 20 papers—45% of those submitted.
Rebuttals
This was the first time that OpenSym used a rebuttal or author response and we are thrilled with how it went. Although they were entirely optional, almost every team of authors used it! Authors of 40 of our 46 submissions (87%!) submitted rebuttals.
The table above shows how average scores changed after authors submitted rebuttals. The table shows that rebuttals’ effect was typically neutral or positive. Most average scores stayed the same but nearly two times as many average scores increased as decreased in the post-rebuttal period. We hope that this made the process feel more fair for authors and I feel, having read them all, that it led to improvements in the quality of final papers.
Page Lengths
In previous years, OpenSym followed most other venues in computer science by allowing submission of two kinds of papers: full papers which could be up to 10 pages long and short papers which could be up to 4. Following some other conferences, we eliminated page limits altogether. This is the text we used in the OpenSym 2017 CFP:
There is no minimum or maximum length for submitted papers. Rather, reviewers will be instructed to weigh the contribution of a paper relative to its length. Papers should report research thoroughly but succinctly: brevity is a virtue. A typical length of a “long research paper” is 10 pages (formerly the maximum length limit and the limit on OpenSym tracks), but may be shorter if the contribution can be described and supported in fewer pages— shorter, more focused papers (called “short research papers” previously) are encouraged and will be reviewed like any other paper. While we will review papers longer than 10 pages, the contribution must warrant the extra length. Reviewers will be instructed to reject papers whose length is incommensurate with the size of their contribution.
The following graph shows the distribution of page lengths across papers in our final program.
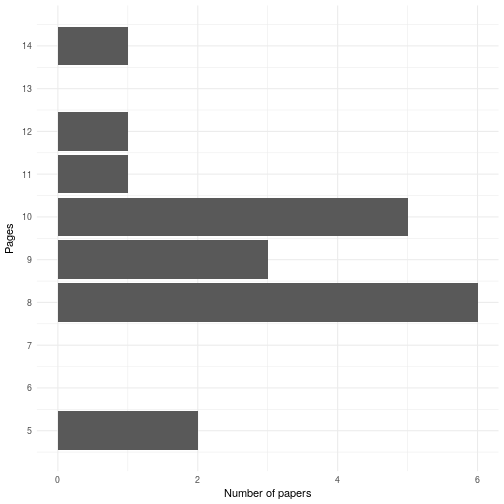 In the end 3 of 20 published papers (15%) were over 10 pages. More surprisingly, 11 of the accepted papers (55%) were below the old 10-page limit. Fears that some have expressed that page limits are the only thing keeping OpenSym from publshing enormous rambling manuscripts seems to be unwarranted—at least so far.
Bidding
Although, I won’t post any analysis or graphs, bidding worked well. With only two exceptions, every single assigned review was to someone who had bid “yes” or “maybe” for the paper in question and the vast majority went to people that had bid “yes.” However, this comes with one major proviso: people that did not bid at all were marked as “maybe” for every single paper.
Given a reviewer pool whose diversity of expertise matches that in your pool of authors, bidding works fantastically. But everybody needs to bid. The only problems with reviewers we had were with people that had failed to bid. It might be reviewers who don’t bid are less committed to the conference, more overextended, more likely to drop things in general, etc. It might also be that reviewers who fail to bid get poor matches which cause them to become less interested, willing, or able to do their reviews well and on time.
Having used bidding twice as chair or track-chair, my sense is that bidding is a fantastic thing to incorporate into any conference review process. The major limitations are that you need to build a program committee (PC) before the conference (rather than finding the perfect reviewers for specific papers) and you have to find ways to incentivize or communicate the importance of getting your PC members to bid.
Conclusions
The final results were a fantastic collection of published papers. Of course, it couldn’t have been possible without the huge collection of conference chairs, associate chairs, program committee members, external reviewers, and staff supporters.
Although we tried quite a lot of new things, my sense is that nothing we changed made things worse and many changes made things smoother or better. Although I’m not directly involved in organizing OpenSym 2018, I am on the OpenSym steering committee. My sense is that most of the changes we made are going to be carried over this year.
Finally, it’s also been announced that OpenSym 2018 will be in Paris on August 22-24. The call for papers should be out soon and the OpenSym 2018 paper deadline has already been announced as March 15, 2018. You should consider submitting! I hope to see you in Paris!
This Analysis
OpenSym used the gratis version of EasyChair to manage the conference which doesn’t allow chairs to export data. As a result, data used in this this postmortem was scraped from EasyChair using two Python scripts. Numbers and graphs were created using a knitr file that combines R visualization and analysis code with markdown to create the HTML directly from the datasets. I’ve made all the code I used to produce this analysis available in this git repository. I hope someone else finds it useful. Because the data contains sensitive information on the review process, I’m not publishing the data.
This blog post was originally posted on the Community Data Science Collective blog.


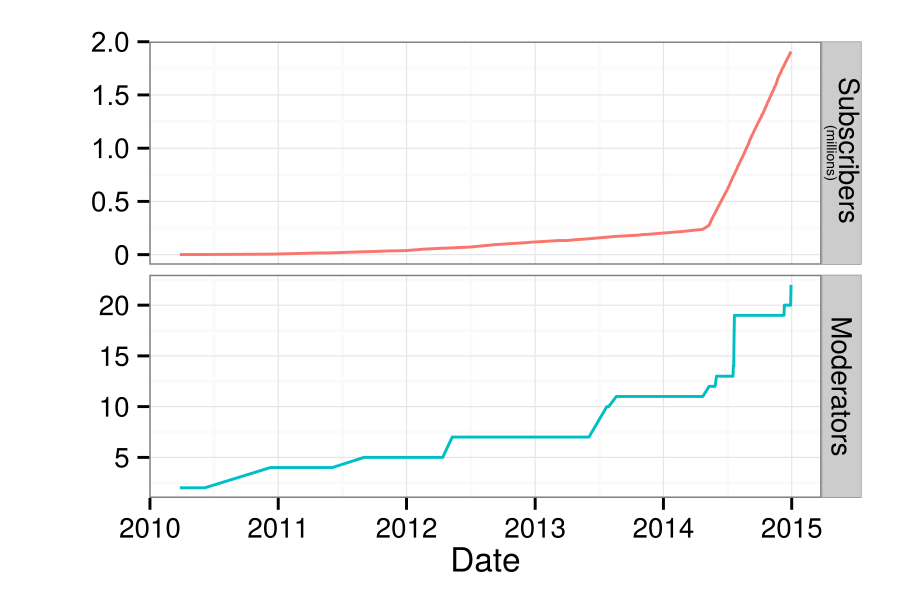
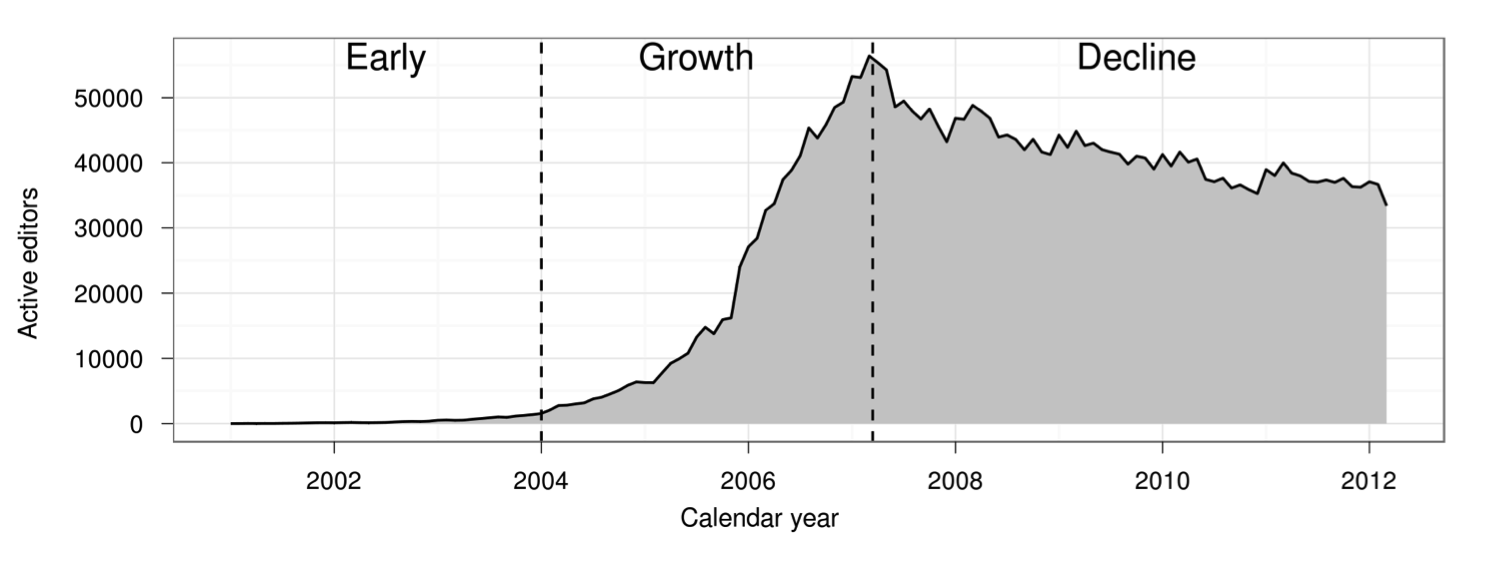 The number of active Wikipedia contributors exploded, suddenly stalled, and then began gradually declining. (Figure taken from Halfaker et al. 2013)
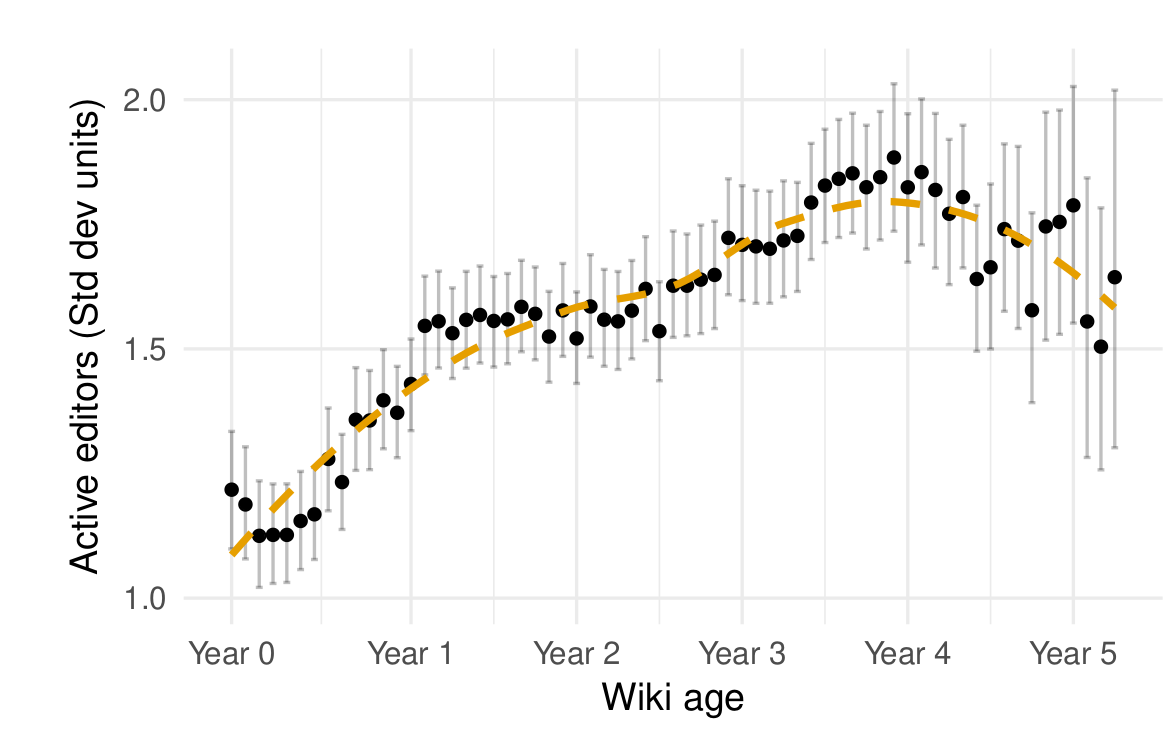 The average Wikia wikia also experience a period of growth followed by stabilization and decline (from TeBlunthuis, Shaw, and Hill 2018).