What does the “maker movement” think of the song “Maker” by Fink?
Is it an accidental anthem or just unfortunate evidence of the semantic ambiguity around an overloaded term?
rebel with rather too many causes
What does the “maker movement” think of the song “Maker” by Fink?
Is it an accidental anthem or just unfortunate evidence of the semantic ambiguity around an overloaded term?
Several months ago, I gave the closing keynote address at LibrePlanet 2018. The talk was about the thing that scares me most about the future of free culture, free software, and peer production.
A video of the talk is online on Youtube and available as WebM video file (both links should skip the first 3m 19s of thanks and introductions).
Here’s a summary of the talk:
App stores and the so-called “sharing economy” are two examples of business models that rely on techniques for the mass aggregation of distributed participation over the Internet and that simply didn’t exist a decade ago. In my talk, I argue that the firms pioneering these new models have learned and adapted processes from commons-based peer production projects like free software, Wikipedia, and CouchSurfing.
The result is an important shift: A decade ago, the kind of mass collaboration that made Wikipedia, GNU/Linux, or Couchsurfing possible was the exclusive domain of people producing freely and openly in commons. Not only is this no longer true, new proprietary, firm-controlled, and money-based models are increasingly replacing, displacing, outcompeting, and potentially reducing what’s available in the commons. For example, the number of people joining Couchsurfing to host others seems to have been in decline since Airbnb began its own meteoric growth.
In the talk, I talk about how this happened and what I think it means for folks of that are committed to working in commons. I talk a little bit about the free culture and free software should do now that mass collaboration, these communities’ most powerful weapon, is being used against them.
I’m very much interested in feedback provided any way you want to reach me including in person, over email, in comments on my blog, on Mastodon, on Twitter, etc.
Work on the research that is reflected and described in this talk was supported by the National Science Foundation (awards IIS-1617129 and IIS-1617468). Some of the initial ideas behind this talk were developed while working on this paper (official link) which was led by Maximilian Klein and contributed to by Jinhao Zhao, Jiajun Ni, Isaac Johnson, and Haiyi Zhu.
When I was growing up in Washington state, a company called Honey Bucket held a dominant position in the local portable toilet market. Their toilets are still a common sight in the American West.
They were so widespread when I was a child that I didn’t know that “Honey Bucket” was the name of a company at all until I moved to Massachusetts for college. I thought “honey bucket” was just the generic term for toilets that could be moved from place-to-place!
So for the first five years that I lived in Massachusetts, I continued to call all portable toilets “honey buckets.”
Until somebody asked me why I called them that—five years after moving!—all my friends in Massachusetts thought that “honey bucket” was just a personal, idiosyncratic, and somewhat gross, euphemism.
Seymour Papert is credited as saying that tools to support learning should have “high ceilings” and “low floors.” The phrase is meant to suggest that tools should allow learners to do complex and intellectually sophisticated things but should also be easy to begin using quickly. Mitchel Resnick extended the metaphor to argue that learning toolkits should also have “wide walls” in that they should appeal to diverse groups of learners and allow for a broad variety of creative outcomes. In a new paper, Sayamindu Dasgupta and I attempted to provide an empirical test of Resnick’s wide walls theory. Using a natural experiment in the Scratch online community, we found causal evidence that “widening walls” can, as Resnick suggested, increase both engagement and learning.
Over the last ten years, the “wide walls” design principle has been widely cited in the design of new systems. For example, Resnick and his collaborators relied heavily on the principle in the design of the Scratch programming language. Scratch allows young learners to produce not only games, but also interactive art, music videos, greetings card, stories, and much more. As part of that team, Sayamindu was guided by “wide walls” principle when he designed and implemented the Scratch cloud variables system in 2011-2012.
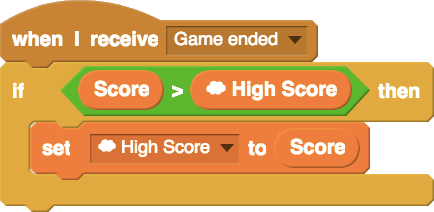
While designing the system, Sayamindu hoped to “widen walls” by supporting a broader range of ways to use variables and data structures in Scratch. Scratch cloud variables extend the affordances of the normal Scratch variable by adding persistence and shared-ness. A simple example of something possible with cloud variables, but not without them, is a global high-score leaderboard in a game (example code is below). After the system was launched, we saw many young Scratch users using the system to engage with data structures in new and incredibly creative ways.
Although these examples reflected powerful anecdotal evidence, we were also interested in using quantitative data to reflect the causal effect of the system. Understanding the causal effect of a new design in real world settings is a major challenge. To do so, we took advantage of a “natural experiment” and some clever techniques from econometrics to measure how learners’ behavior changed when they were given access to a wider design space.
Understanding the design of our study requires understanding a little bit about how access to the Scratch cloud variable system is granted. Although the system has been accessible to Scratch users since 2013, new Scratch users do not get access immediately. They are granted access only after a certain amount of time and activity on the website (the specific criteria are not public). Our “experiment” involved a sudden change in policy that altered the criteria for who gets access to the cloud variable feature. Through no act of their own, more than 14,000 users were given access to feature, literally overnight. We looked at these Scratch users immediately before and after the policy change to estimate the effect of access to the broader design space that cloud variables afforded.
We found that use of data-related features was, as predicted, increased by both access to and use of cloud variables. We also found that this increase was not only an effect of projects that use cloud variables themselves. In other words, learners with access to cloud variables—and especially those who had used it—were more likely to use “plain-old” data-structures in their projects as well.
The graph below visualizes the results of one of the statistical models in our paper and suggests that we would expect that 33% of projects by a prototypical “average” Scratch user would use data structures if the user in question had never used used cloud variables but that we would expect that 60% of projects by a similar user would if they had used the system.
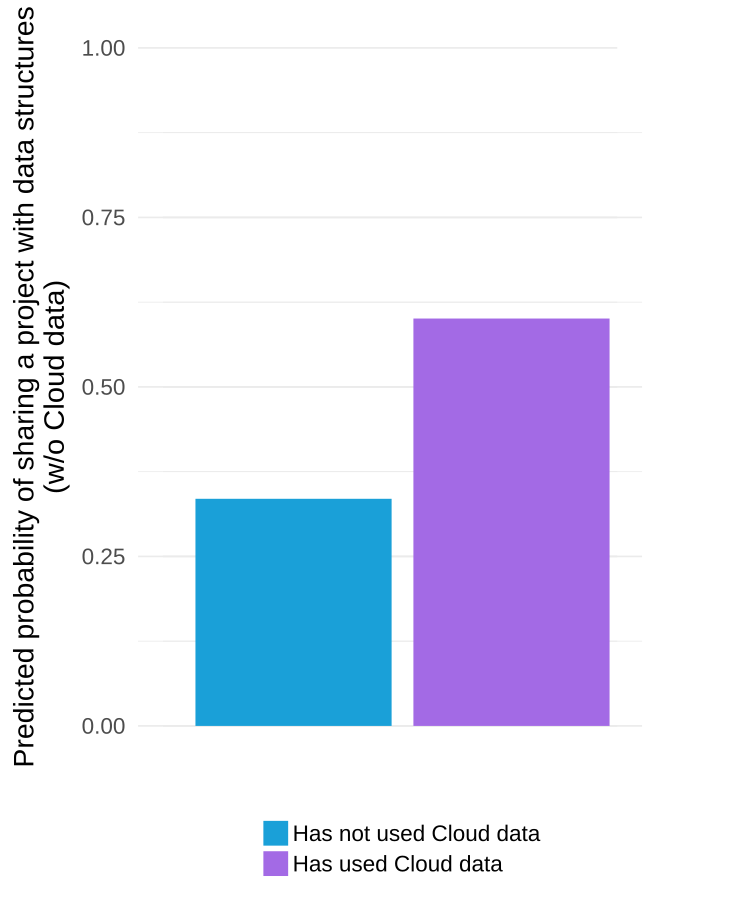
It is important to note that the estimated effective above is a “local average effect” among people who used the system because they were granted access by the sudden change in policy (this is a subtle but important point that we explain this in some depth in the paper). Although we urge care and skepticism in interpreting our numbers, we believe our results are encouraging evidence in support of the “wide walls” design principle.
Of course, our work is not without important limitations. Critically, we also found that rate of adoption of cloud variables was very low. Although it is hard to pinpoint the exact reason for this from the data we observed, it has been suggested that widening walls may have a potential negative side-effect of making it harder for learners to imagine what the new creative possibilities might be in the absence of targeted support and scaffolding. Also important to remember is that our study measures “wide walls” in a specific way in a specific context and that it is hard to know how well our findings will generalize to other contexts and communities. We discuss these caveats, as well as our methods, models, and theoretical background in detail in our paper which now available for download as an open-access piece from the ACM digital library.
This blog post, and the open access paper that it describes, is a collaborative project with Sayamindu Dasgupta. Financial support came from the eScience Institute and the Department of Communication at the University of Washington. Quantitative analyses for this project were completed using the Hyak high performance computing cluster at the University of Washington.
Mount Rainier is an enormous glaciated volcano in Washington state. It’s 4,392 meters tall (14,410 ft) and extraordinary prominent. The mountain is 87 km (54m) away from Seattle. On clear days, it dominates the skyline.
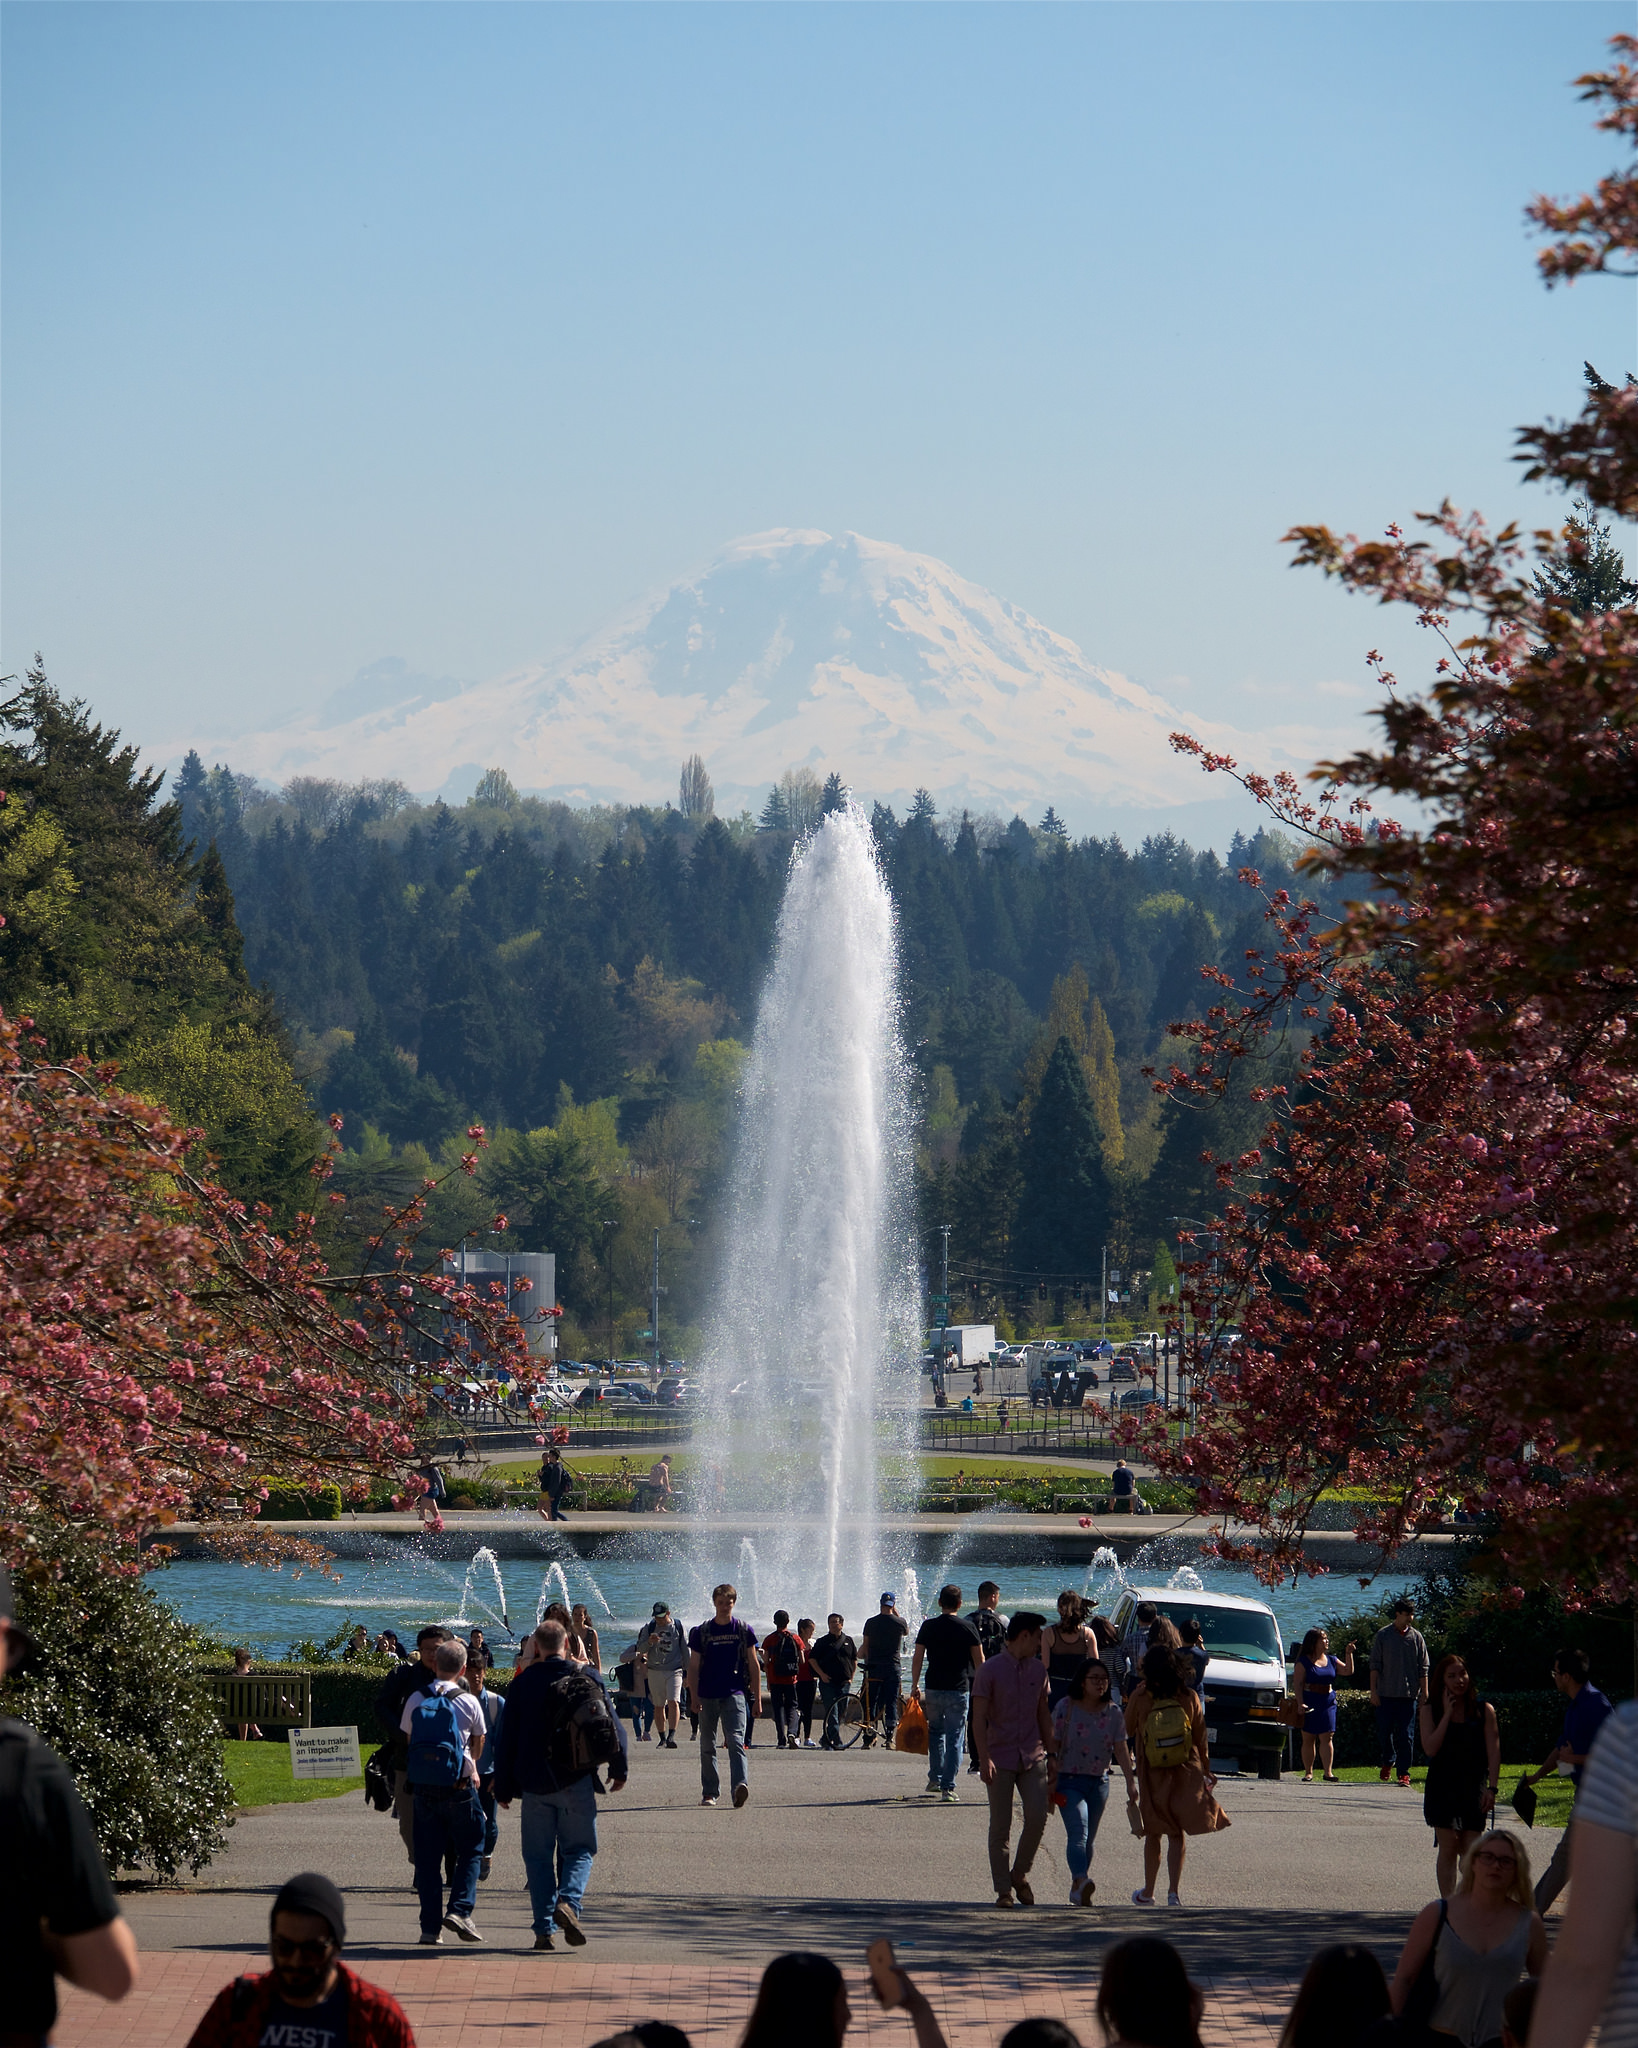
Rainier’s presence has shaped the layout and structure of Seattle. Important roads are built to line up with it. The buildings on the University of Washington’s campus, where I work, are laid out to frame it along the central promenade. People in Seattle typically refer to Rainier simply as “the mountain.” It is common to here Seattlites ask “is the mountain out?”
Having grown up in Seattle, I have an deep emotional connection to the mountain that’s difficult to explain to people who aren’t from here. I’ve seen Rainier thousands of times and every single time it takes my breath away. Every single day when I bike to work, I stop along UW’s “Rainier Vista” and look back to see if the mountain is out. If it is, I always—even if I’m running late for a meeting—stop for a moment to look at it. When I lived elsewhere and would fly to visit Seattle, seeing Rainier above the clouds from the plane was the moment that I felt like I was home.
Given this connection, I’ve always been interested in climbing Mt. Rainier. Doing so typically takes at least a couple days and is difficult. About half of people who attempt typically fail to reach the top. For me, climbing rainier required an enormous amount of training and gear because, until recently, I had no experience with mountaineering. I’m not particularly interested in climbing mountains in general. I am interested in Rainier.

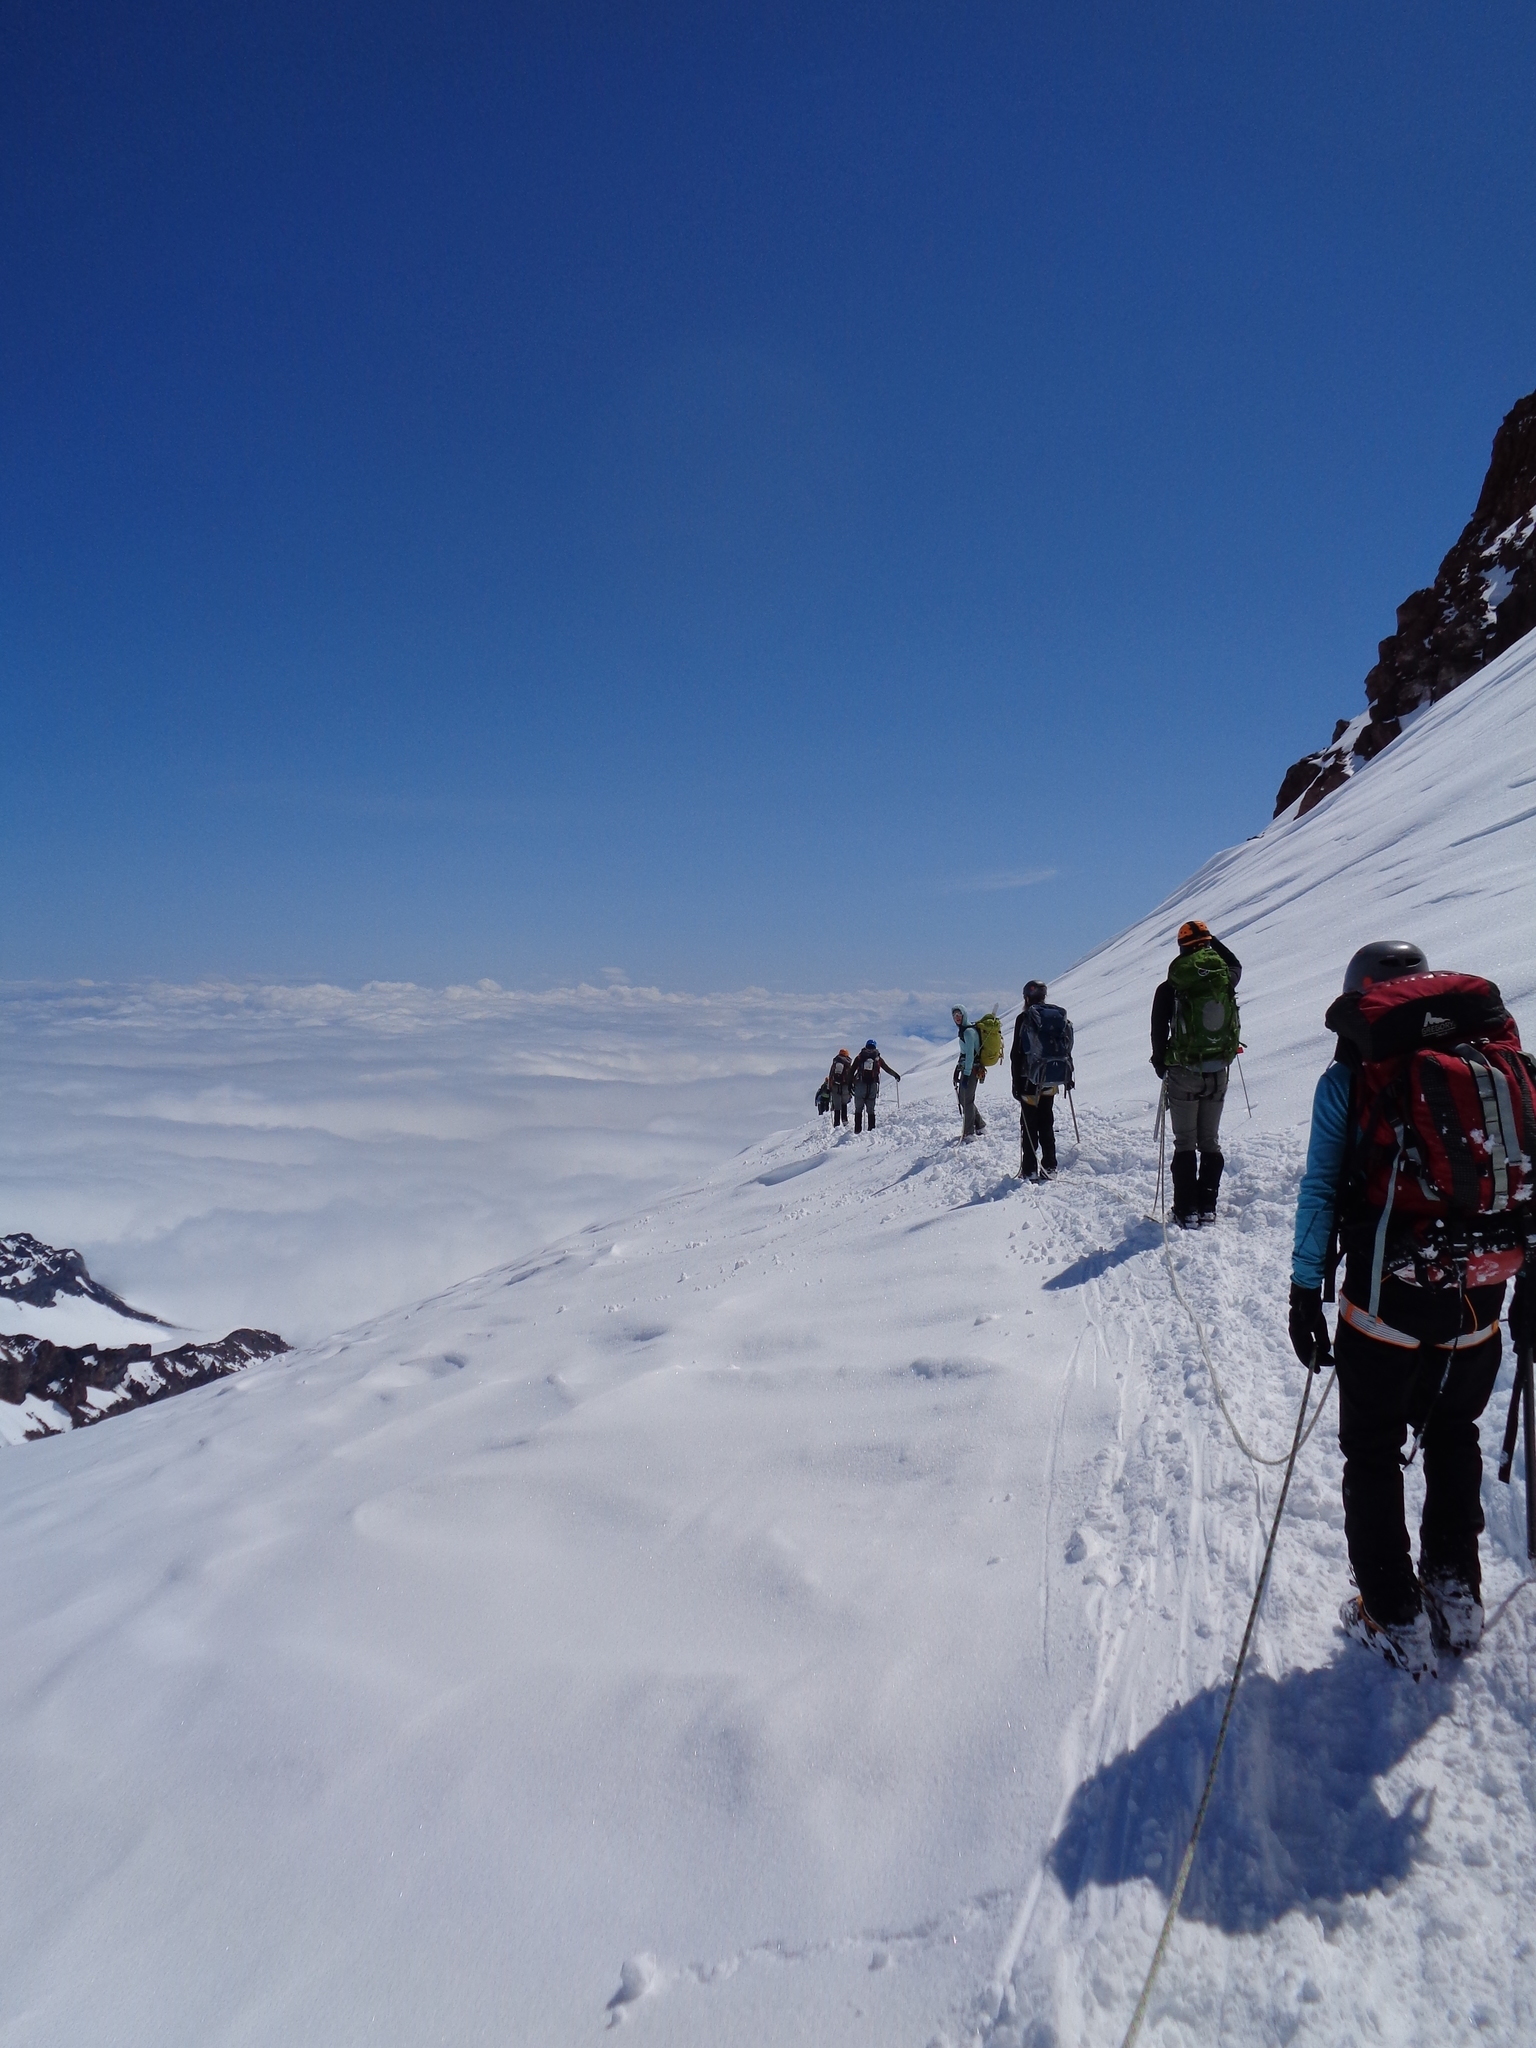
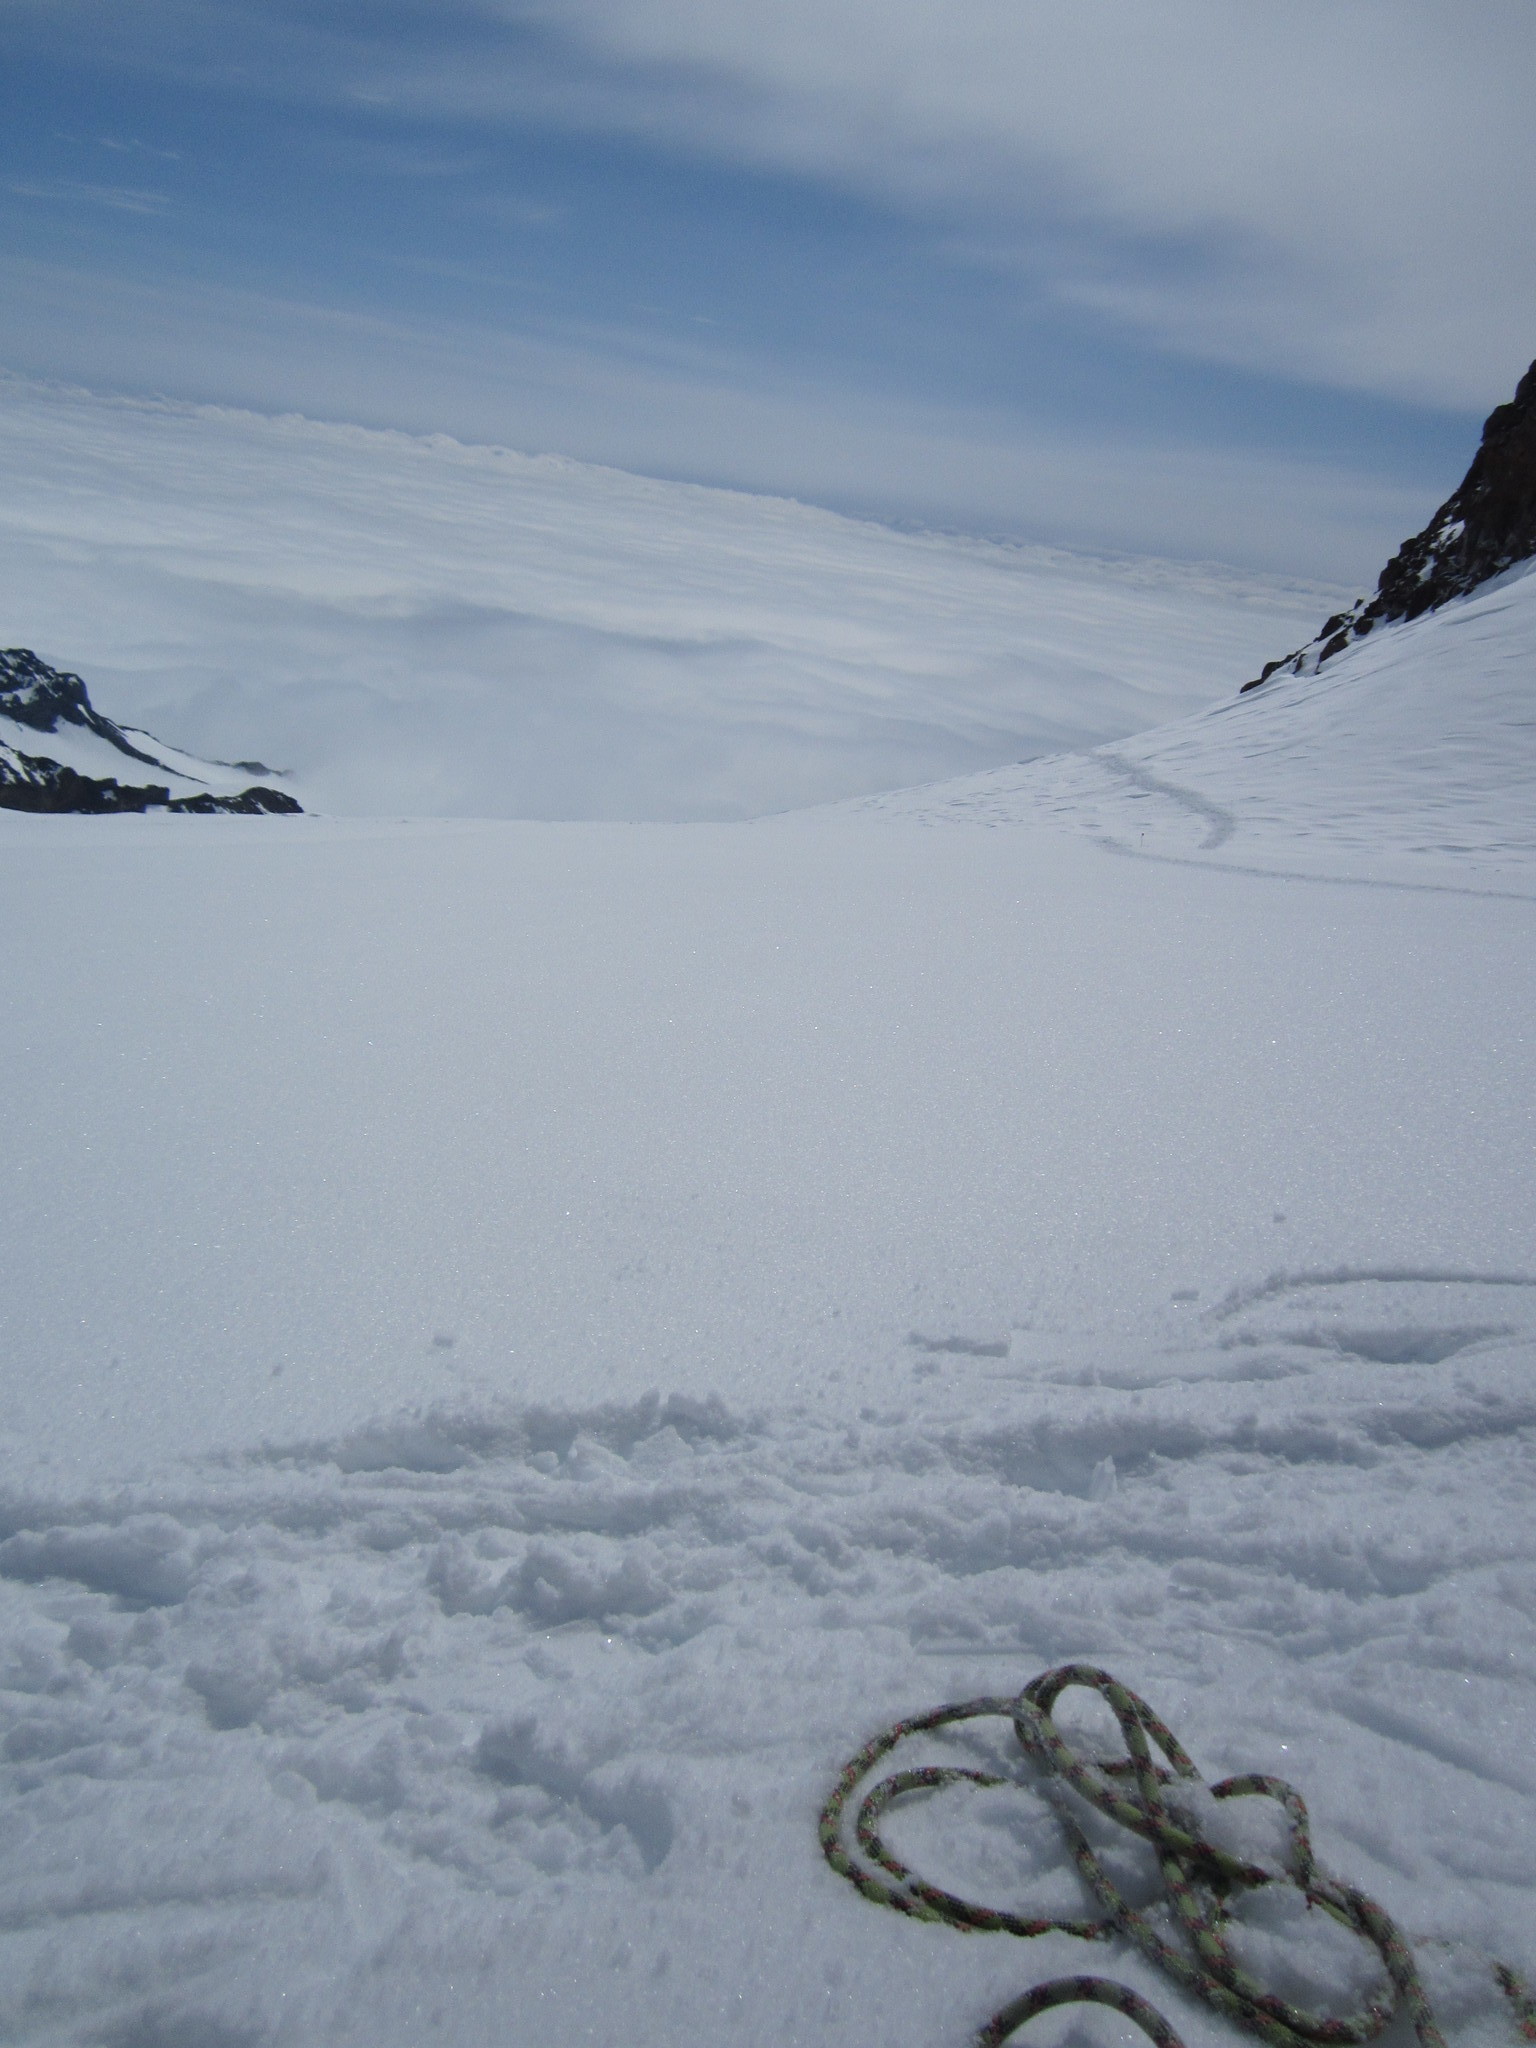
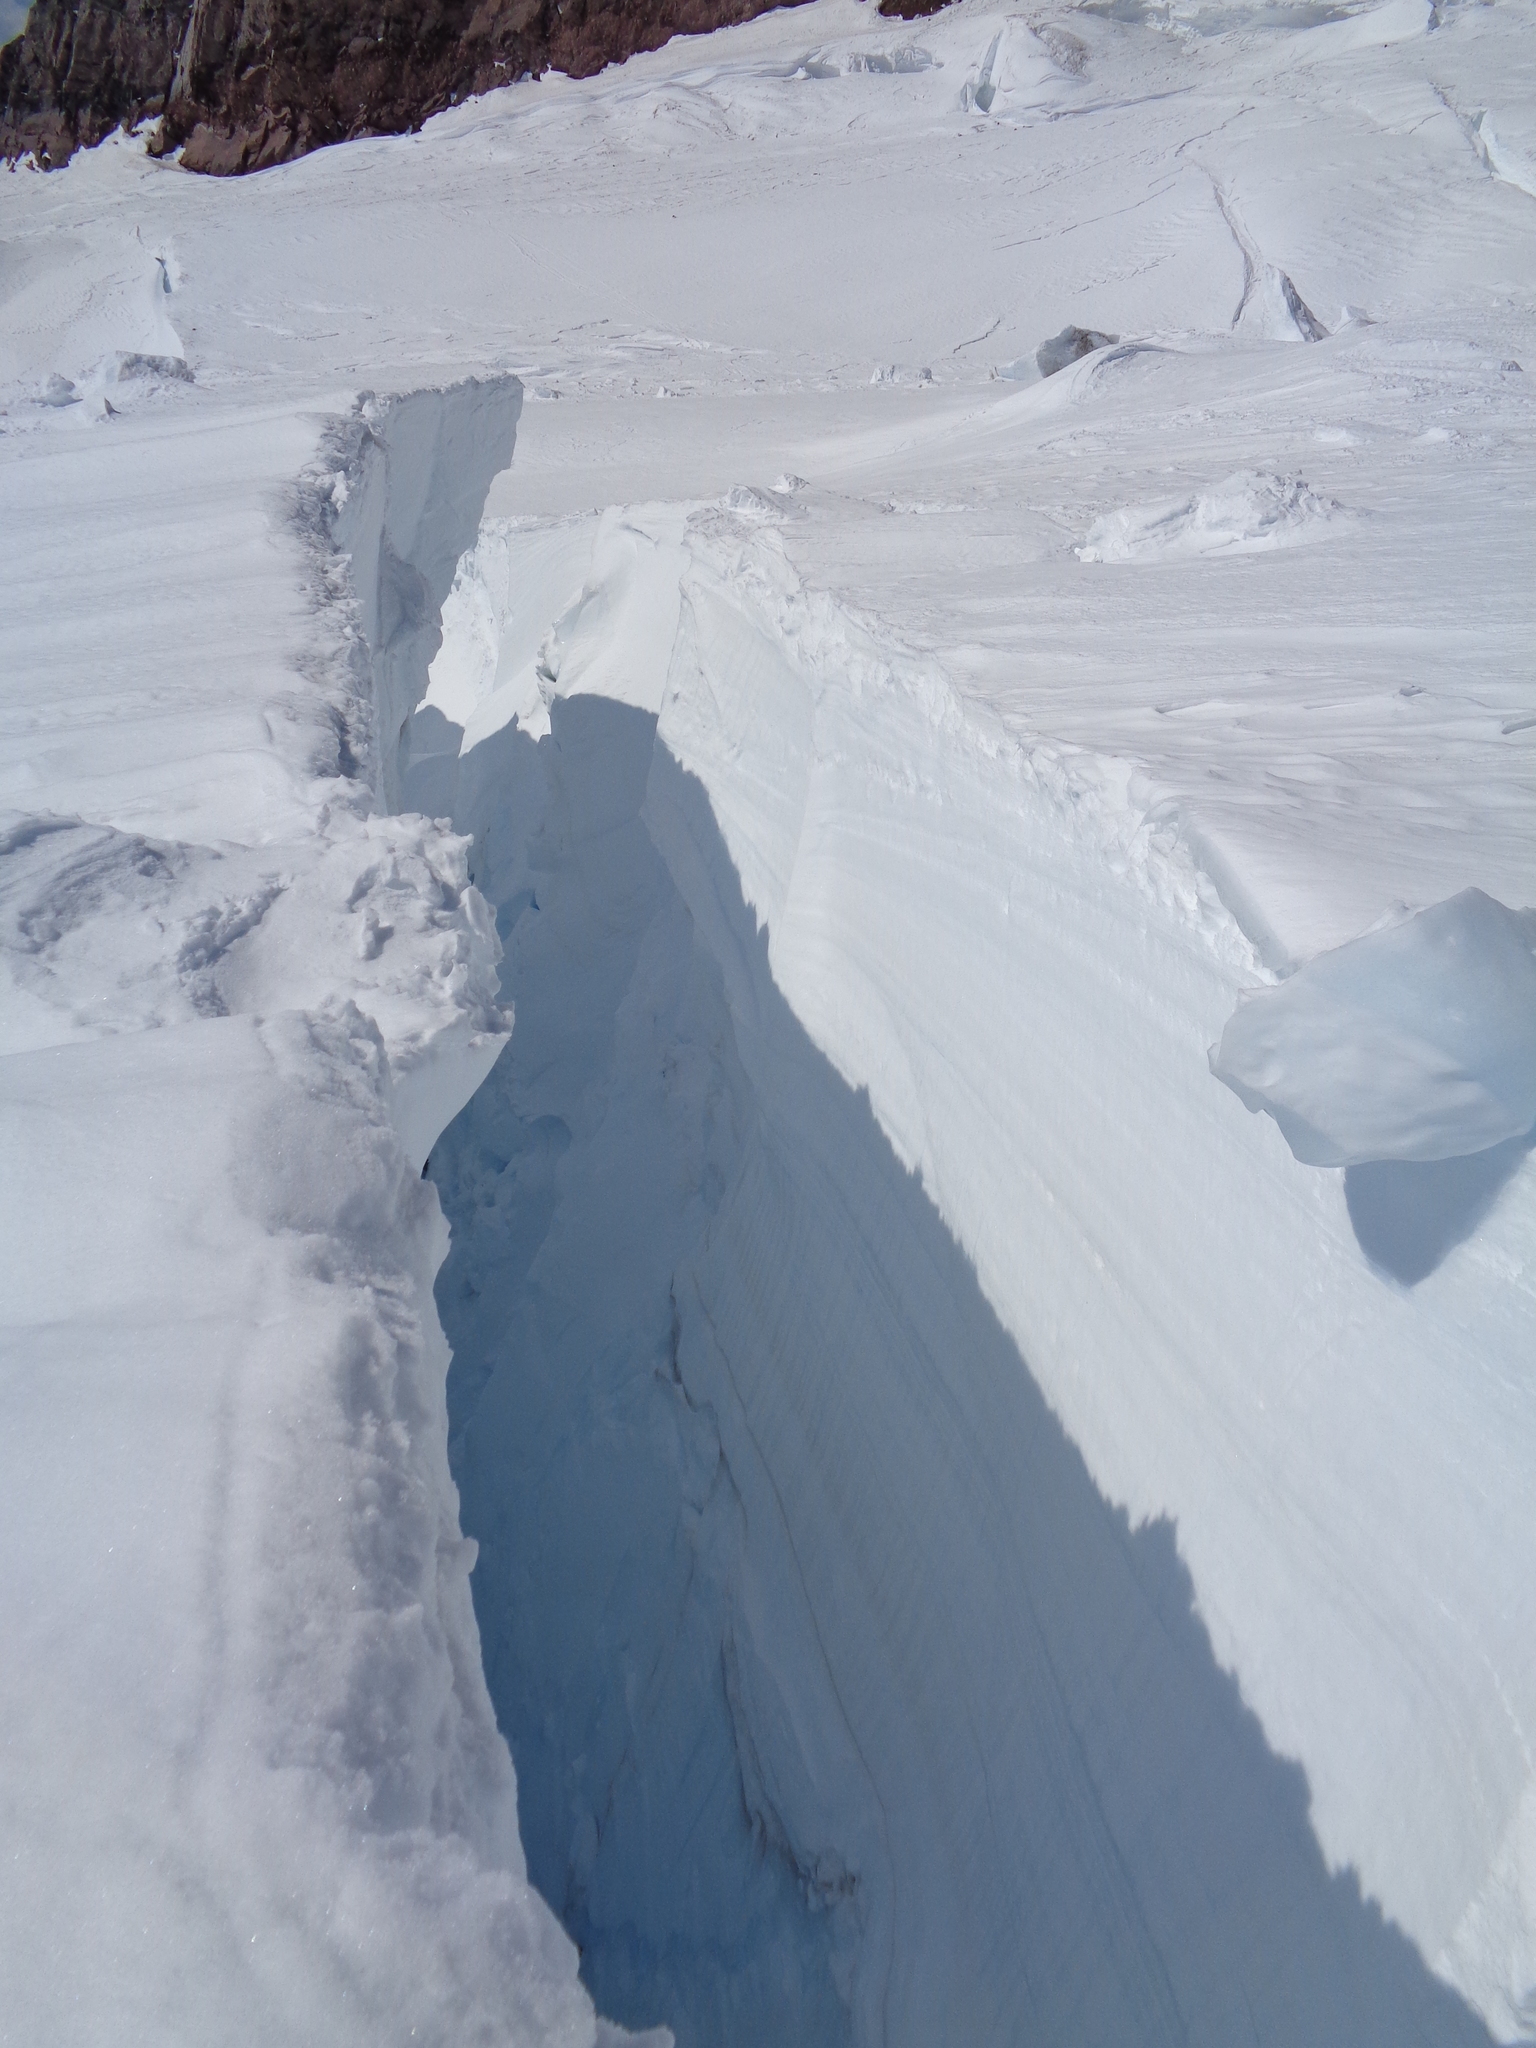

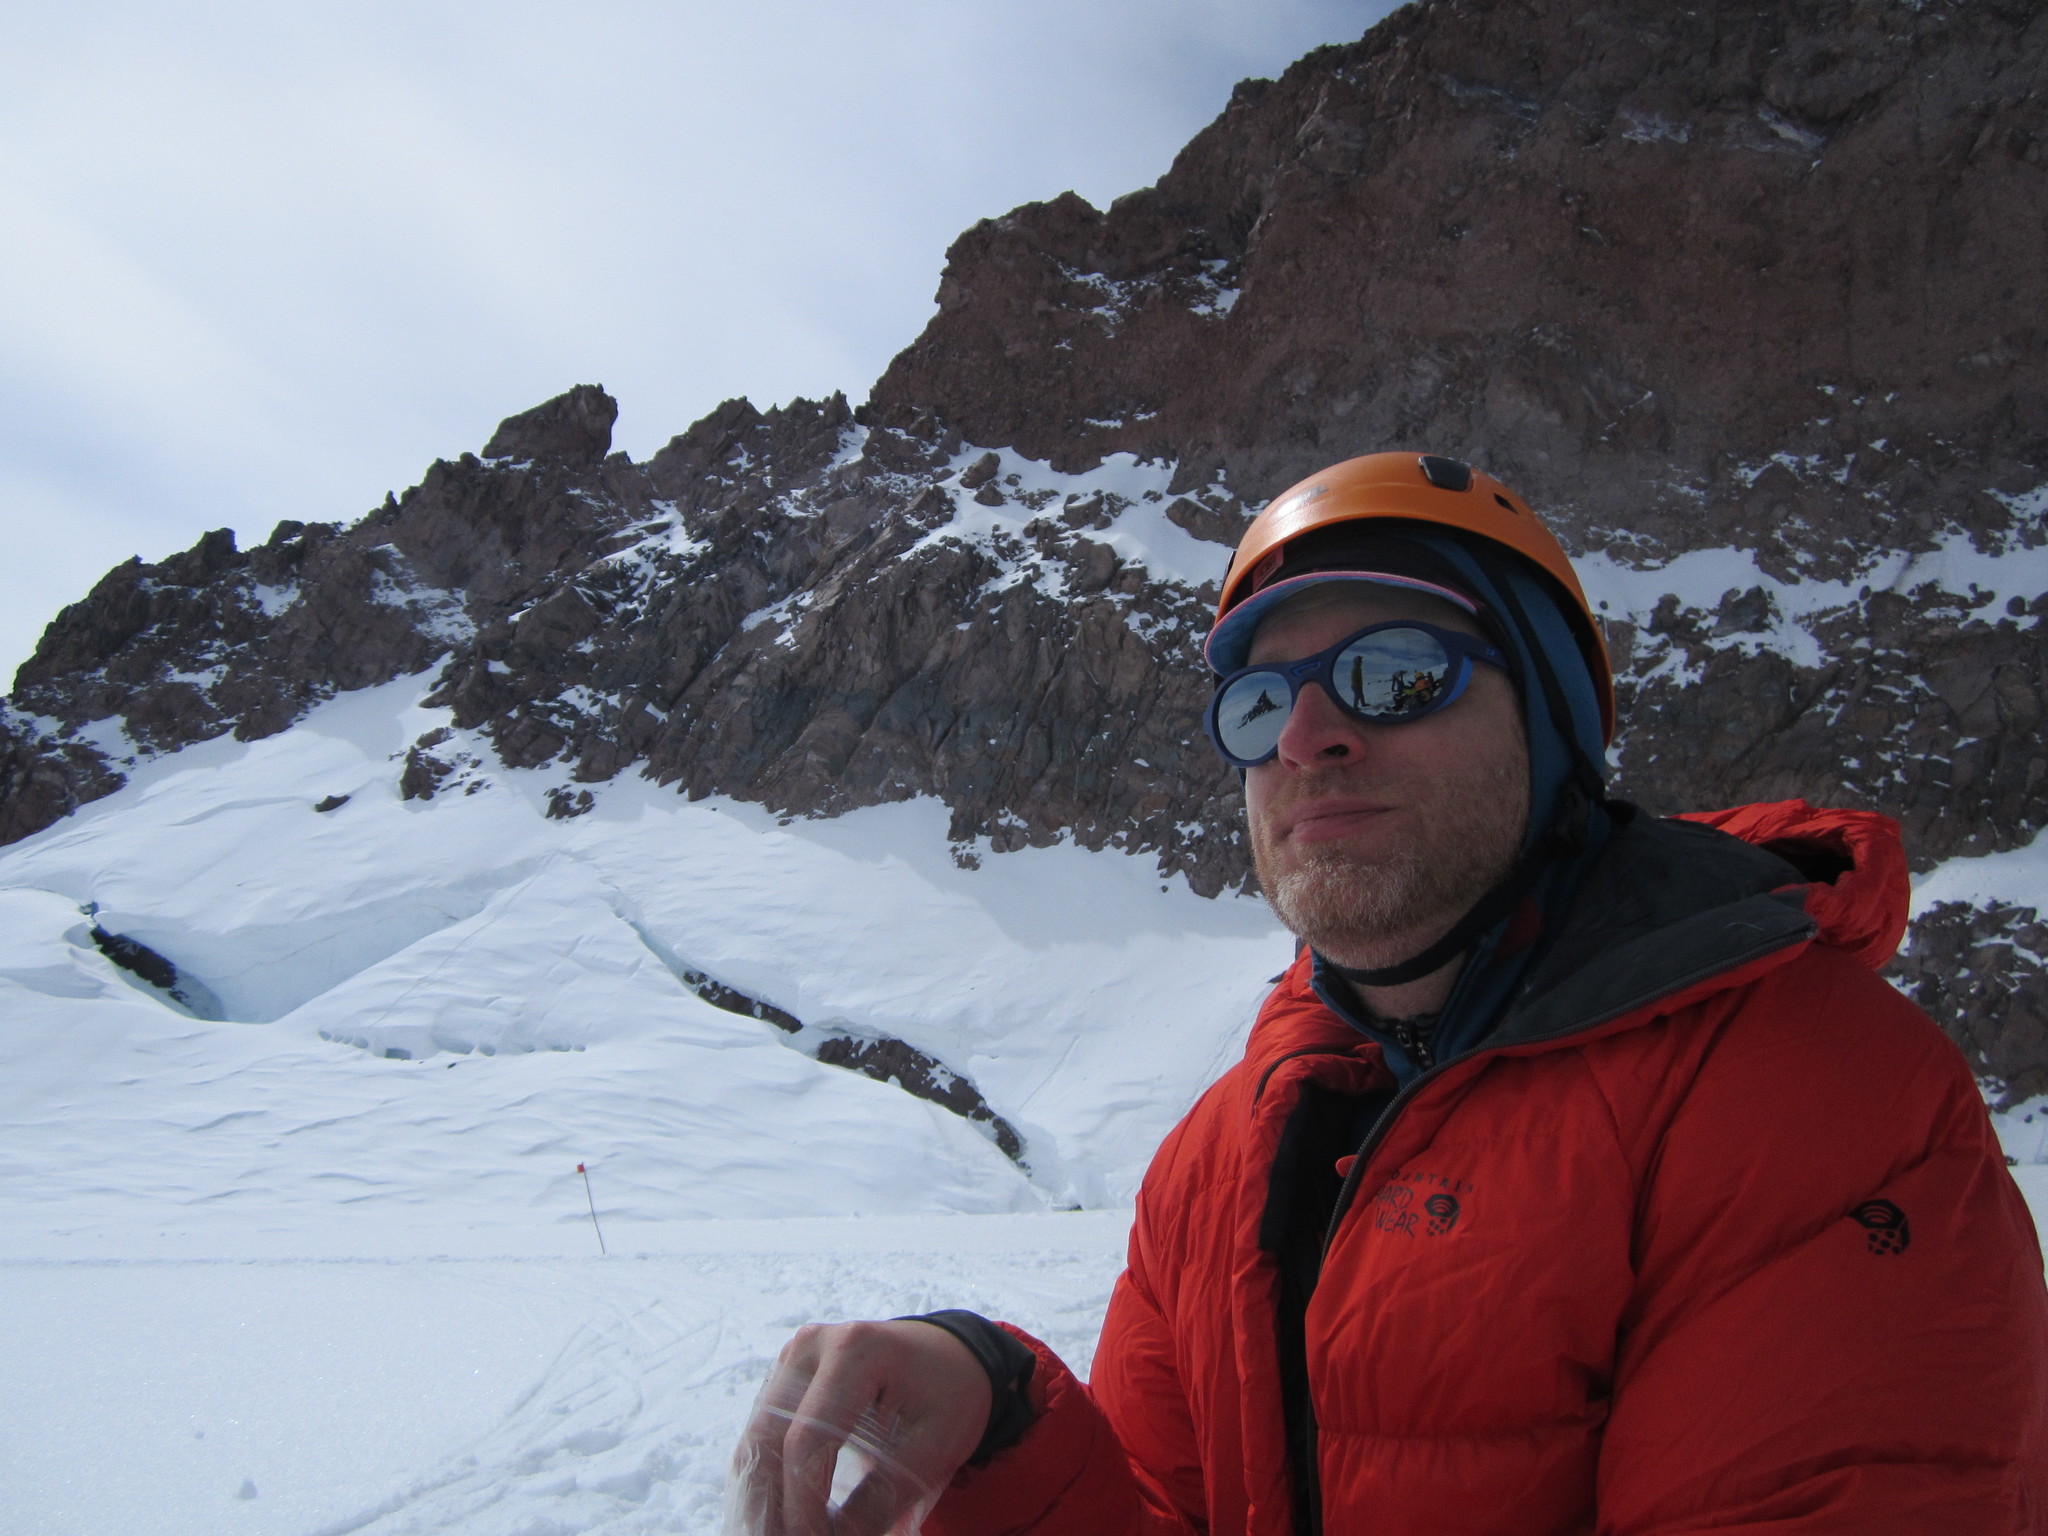
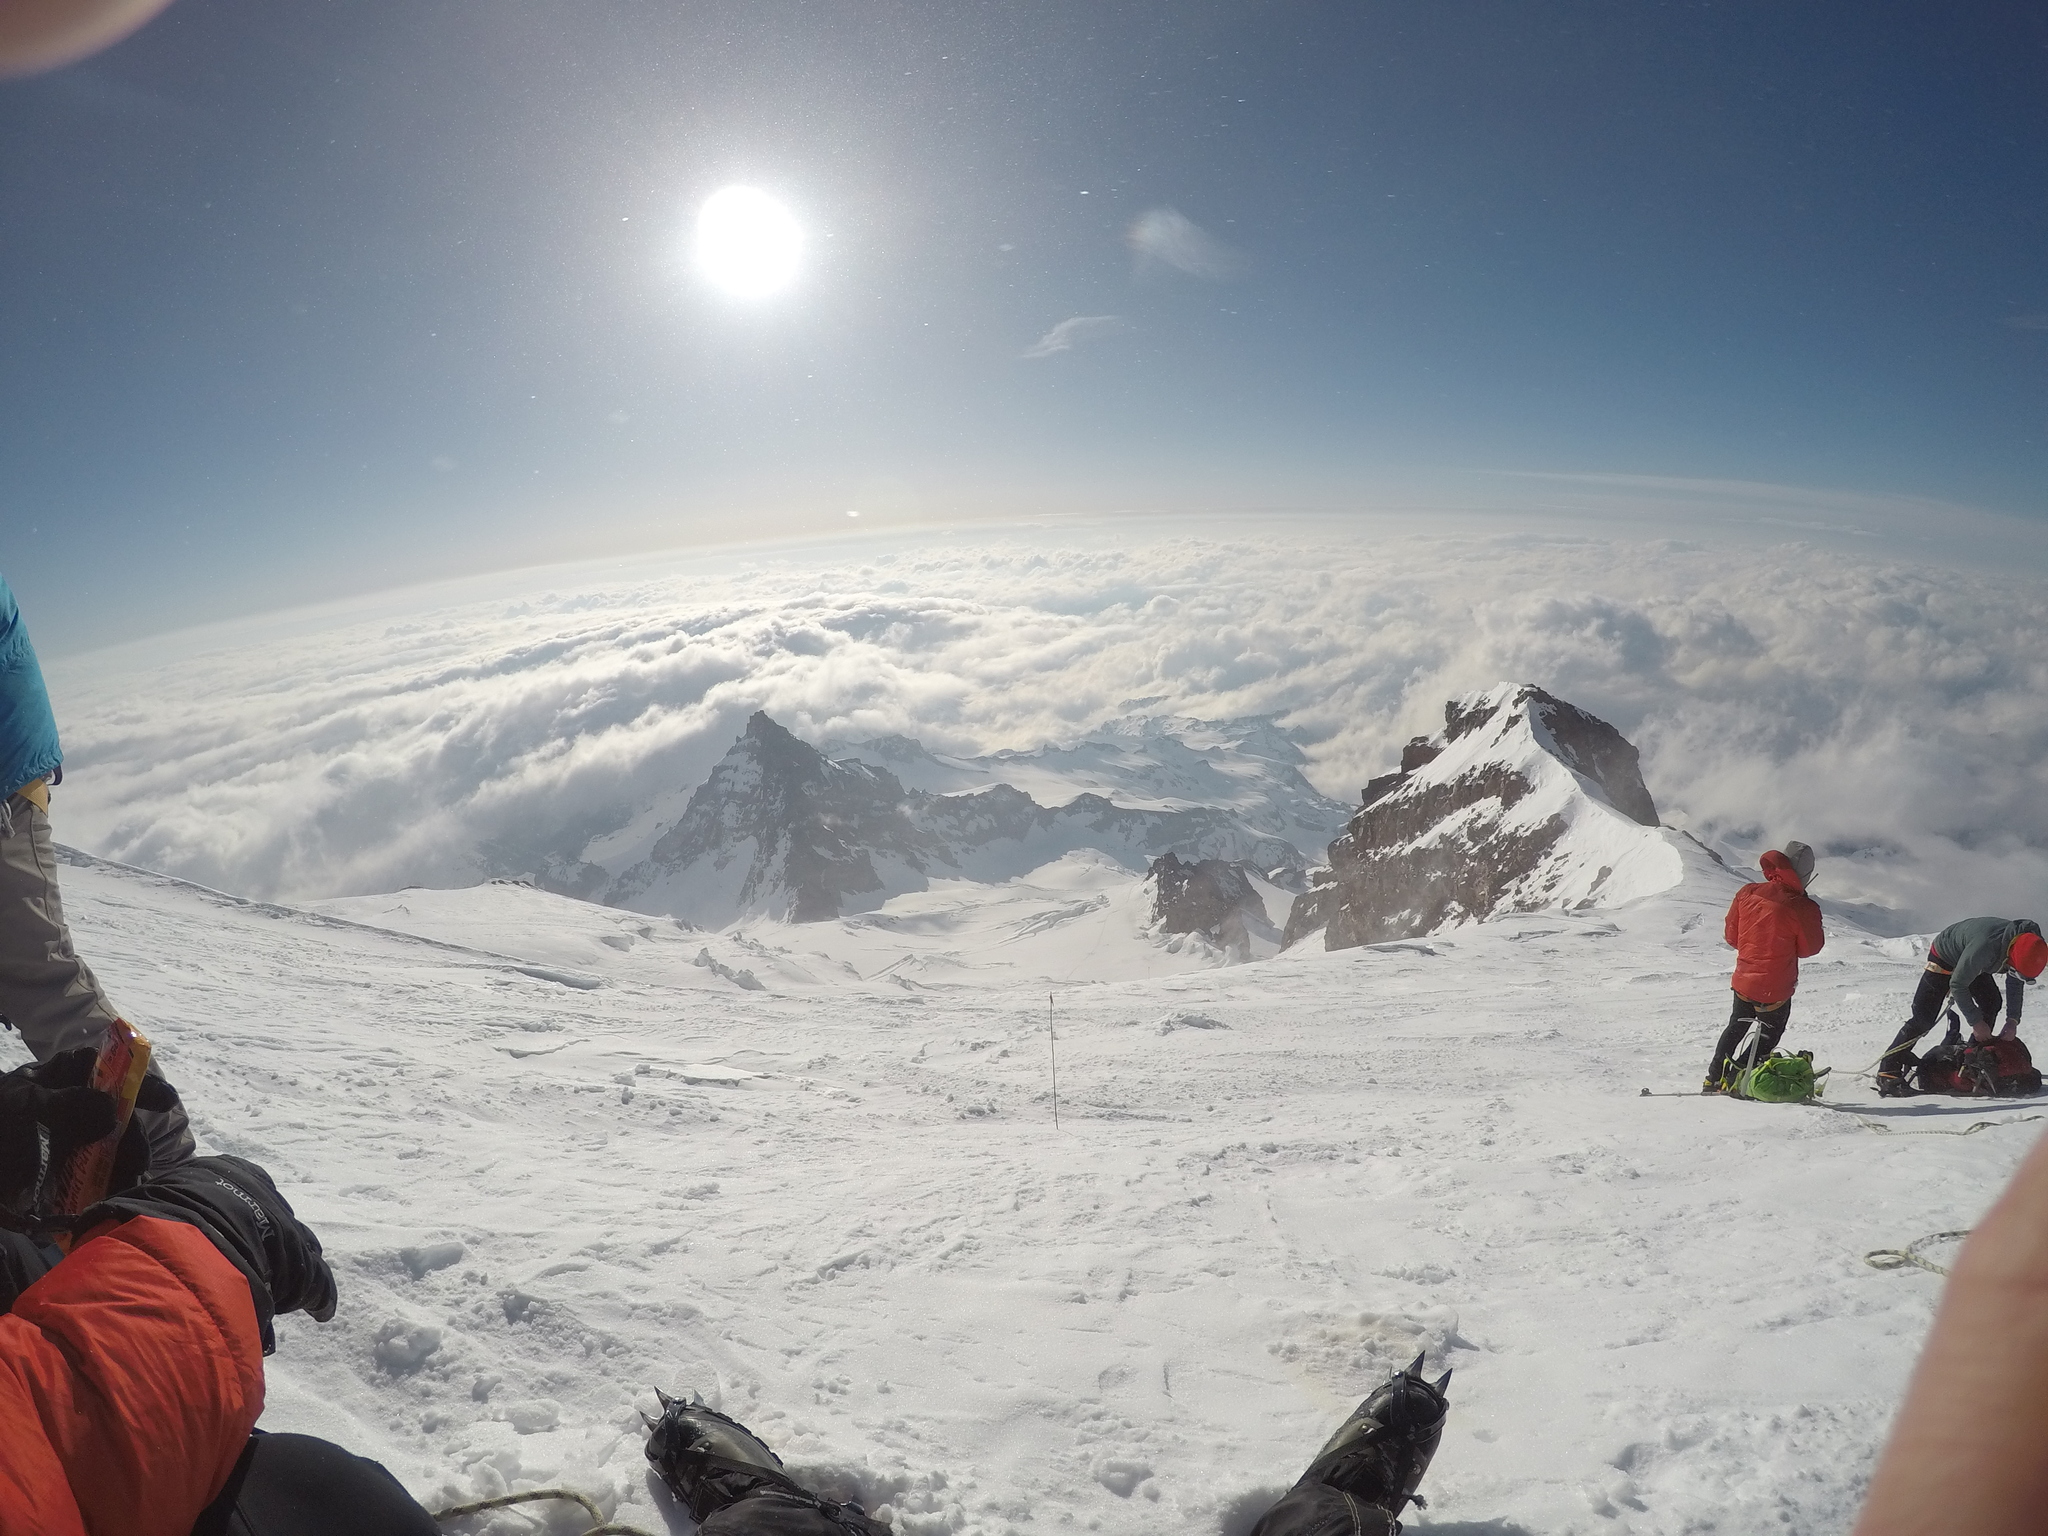
On Tuesday, Mika and I made our first climbing attempt and we both successfully made it to the summit. Due to the -15°C (5°F) temperatures and 88kph (55mph) winds at the top, I couldn’t get a picture at the top. But I feel like I’ve built a deeper connection with an old friend.
Other than the picture from UW campus, photos were all from my climb and taken by (in order): Jennifer Marie, Jonathan Neubauer, Mika Matsuzaki, Jonathan Neubauer, Jonathan Neubauer, Mika Matsuzaki, and Jake Holthaus.
This graph shows the number of people contributing to Wikipedia over time:
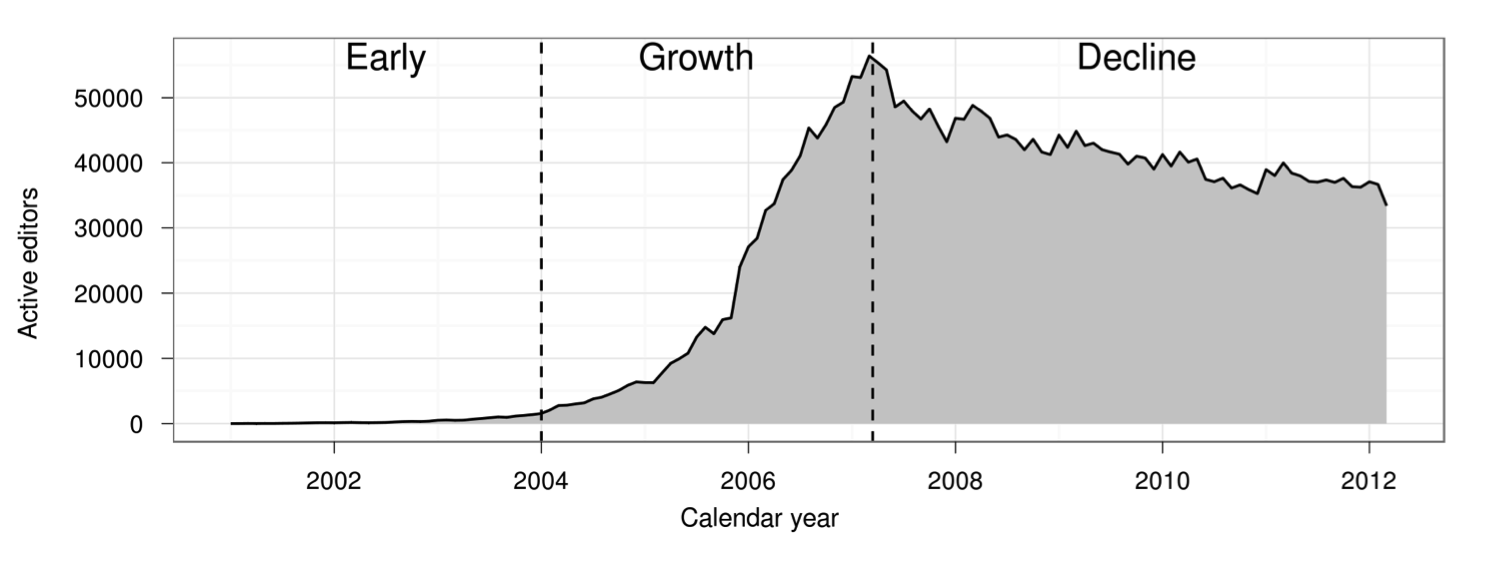 The number of active Wikipedia contributors exploded, suddenly stalled, and then began gradually declining. (Figure taken from Halfaker et al. 2013)
The figure comes from “The Rise and Decline of an Open Collaboration System,” a well-known 2013 paper that argued that Wikipedia’s transition from rapid growth to slow decline in 2007 was driven by an increase in quality control systems. Although many people have treated the paper’s finding as representative of broader patterns in online communities, Wikipedia is a very unusual community in many respects. Do other online communities follow Wikipedia’s pattern of rise and decline? Does increased use of quality control systems coincide with community decline elsewhere?
In a paper that my student Nathan TeBlunthuis is presenting Thursday morning at the Association for Computing Machinery (ACM) Conference on Human Factors in Computing Systems (CHI), a group of us have replicated and extended the 2013 paper’s analysis in 769 other large wikis. We find that the dynamics observed in Wikipedia are a strikingly good description of the average Wikia wiki. They appear to reoccur again and again in many communities.
The original “Rise and Decline” paper (we’ll abbreviate it “RAD”) was written by Aaron Halfaker, R. Stuart Geiger, Jonathan T. Morgan, and John Riedl. They analyzed data from English Wikipedia and found that Wikipedia’s transition from rise to decline was accompanied by increasing rates of newcomer rejection as well as the growth of bots and algorithmic quality control tools. They also showed that newcomers whose contributions were rejected were less likely to continue editing and that community policies and norms became more difficult to change over time, especially for newer editors.
Our paper, just published in the CHI 2018 proceedings, replicates most of RAD’s analysis on a dataset of 769 of the largest wikis from Wikia that were active between 2002 to 2010. We find that RAD’s findings generalize to this large and diverse sample of communities.
We can walk you through some of the key findings. First, the growth trajectory of the average wiki in our sample is similar to that of English Wikipedia. As shown in the figure below, an initial period of growth stabilizes and leads to decline several years later.
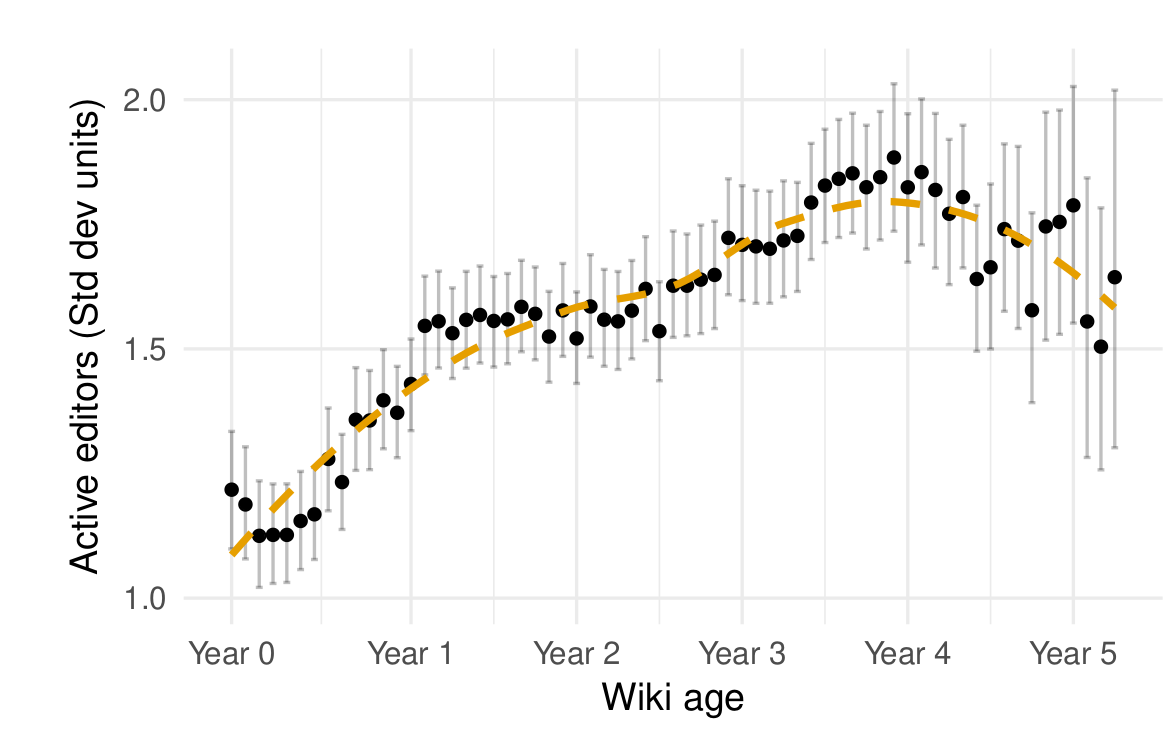 The average Wikia wikia also experience a period of growth followed by stabilization and decline (from TeBlunthuis, Shaw, and Hill 2018).
We also found that newcomers on Wikia wikis were reverted more and continued editing less. As on Wikipedia, the two processes were related. Similar to RAD, we also found that newer editors were more likely to have their contributions to the “project namespace” (where policy pages are located) undone as wikis got older. Indeed, the specific estimates from our statistical models are very similar to RAD’s for most of these findings!
There were some parts of the RAD analysis that we couldn’t reproduce in our context. For example, there are not enough bots or algorithmic editing tools in Wikia to support statistical claims about their effects on newcomers.
At the same time, we were able to do some things that the RAD authors could not. Most importantly, our findings discount some Wikipedia-specific explanations for a rise and decline. For example, English Wikipedia’s decline coincided with the rise of Facebook, smartphones, and other social media platforms. In theory, any of these factors could have caused the decline. Because the wikis in our sample experienced rises and declines at similar points in their life-cycle but at different points in time, the rise and decline findings we report seem unlikely to be caused by underlying temporal trends.
The big communities we study seem to have consistent “life cycles” where stabilization and/or decay follows an initial period of growth. The fact that the same kinds of patterns happen on English Wikipedia and other online groups implies a more general set of social dynamics at work that we do not think existing research (including ours) explains in a satisfying way. What drives the rise and decline of communities more generally? Our findings make it clear that this is a big, important question that deserves more attention.
We hope you’ll read the paper and get in touch by commenting on this post or emailing Nate if you’d like to learn or talk more. The paper is available online and has been published under an open access license. If you really want to get into the weeds of the analysis, we will soon publish all the data and code necessary to reproduce our work in a repository on the Harvard Dataverse.
Nate TeBlunthuis will be presenting the project this week at CHI in Montréal on Thursday April 26 at 9am in room 517D. For those of you not familiar with CHI, it is the top venue for Human-Computer Interaction. All CHI submissions go through double-blind peer review and the papers that make it into the proceedings are considered published (same as journal articles in most other scientific fields). Please feel free to cite our paper and send it around to your friends!
This blog post, and the open access paper that it describes, is a collaborative project with Aaron Shaw, that was led by Nate TeBlunthuis. A version of this blog post was originally posted on the Community Data Science Collective blog. Financial support came from the US National Science Foundation (grants IIS-1617129, IIS-1617468, and GRFP-2016220885 ), Northwestern University, the Center for Advanced Study in the Behavioral Sciences at Stanford University, and the University of Washington. This project was completed using the Hyak high performance computing cluster at the University of Washington.
I recently discovered a prolific and sustained community of meme-makers on Tumblr dedicated to expressing their strong dislike for “Mako.”
Two tags with examples are #mako hate and #anti mako but there are many others.

I’ve also discovered Tumblrs entirely dedicated to the topic!
For example, Let’s Roast Mako describes itself “A place to beat up Mako. In peace. It’s an inspiration to everyone!”
The second is the Fuck Mako Blog which describes itself with series of tag-lines including “Mako can fuck right off and we’re really not sorry about that,” “Welcome aboard the SS Fuck-Mako;” and “Because Mako is unnecessary.” Sub-pages of the site include:
I’ll admit I’m a little disquieted.
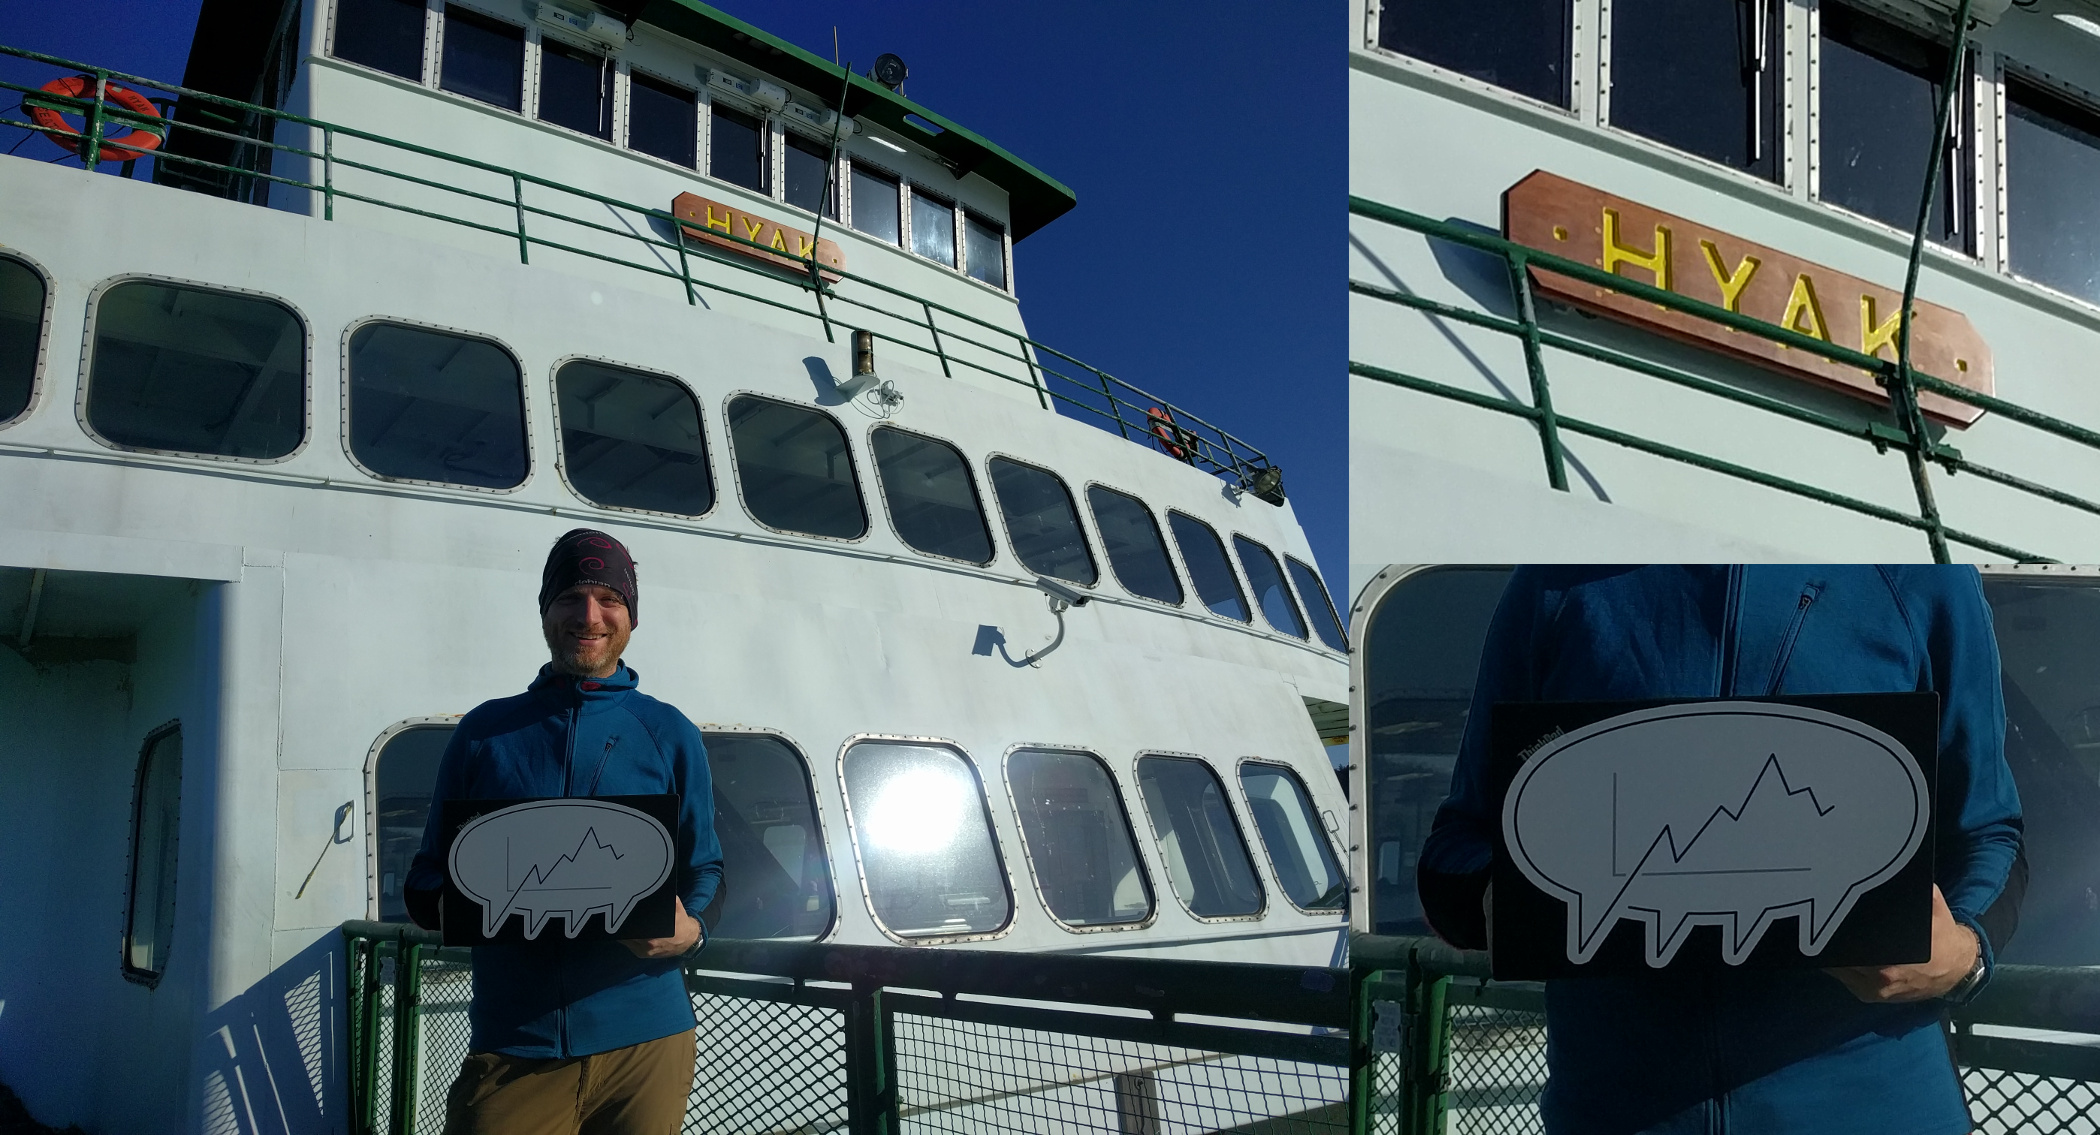
I recently fulfilled a yearslong dream of launching a job on Hyak* on Hyak†.
The University of Washington’s brand page recently started publishing letterhead templates that departments and faculty can use for official communication. Unfortunately, they only provide them in Microsoft Word DOCX format.
Because my research group works in TeX for everything, Sayamindu Dasgupta and I worked together to create a LaTeX version of the “Matrix Department Signature Template” (the DOCX file is available here). We figured other folks at UW might be interested in it as well.
The best way to get the template to use it yourself is to clone it from the pubic git repository we host (git clone 'https://gitea.communitydata.science/mako/uw_tex_letterhead'). If you notice issues or if you want to create branches with either of the other two types of official UW stationary, patches are always welcome (instructions on how to make and send patches is here)!
Because the template relies on two OpenType fonts, it requires XeTeX. A detailed list of the dependencies is provided in the README file. We’ve only run it on GNU/Linux (Debian and Arch) but it should work well on any operating system that can run XeTeX as well as web-based TeX systems like Overleaf.
And although we created the template, keep in mind that we don’t manage UW’s brand identity in anyway. If you have any questions or concerns about if and when you should use the letterhead, you should contact brand and creative services with the contact information on the stationery page.
Updated: Updated URL as we’ve moved from gitweb/gitdaemon to Gitea. [2025-06-14]
![]()
My research collective, the Community Data Science Collective, just announced that we’ll be hosting a event on casual inference in online community research!
We believe this will be the first event on casual inference in any field. We look forward to relaxing our assumptions, and so much more!
XORcise (ɛɡ.zɔʁ.siz) verb 1. To remove observations from a dataset if they satisfy one of two criteria, but not both. [e.g., After XORcising adults and citizens, only foreign children and adult citizens were left.]
Somebody recently asked me if I am the star of bash.org quote #75514 (a snippet of online chat from a large collaboratively built collection):
<mako> my letter "eye" stopped worng
<luca> k, too?
<mako> yeah
<luca> sounds like a mountain dew spill
<mako> and comma
<mako> those three
<mako> ths s horrble
<luca> tme for a new eyboard
<luca> 've successfully taen my eyboard apart
       and fxed t by cleanng t wth alcohol
<mako> stop mang fun of me
<mako> ths s a laptop!!
It was me. A circuit on my laptop had just blown out my I, K, ,, and 8 keys. At the time I didn’t think it was very funny.
I no idea anyone had saved a log and had forgotten about the experience until I saw the bash.org quote. I appreciate it now so I’m glad somebody did!
This was unrelated to the time that I poured water into two computers in front of 1,500 people and the time that I carefully placed my laptop into a full bucket of water.

Did I forget a period of my life when I grew a horseshoe mustache and dreadlocks, walked around topless, and illustrated this 2009 article in the Economist on the economic boon that hippy festivals represent to rural American communities?
Previous lookalikes are here.
![]()
Kuro5hin (pronounced “corrosion” and abbreviated K5) was a website created in 1999 that was popular in the early 2000s. K5 users could post stories to be voted upon as well as entries to their personal diaries.
I posted a couple dozen diary entries between 2002 and 2003 during my final year of college and the months immediately after.
K5 was taken off-line in 2016 and the Internet Archive doesn’t seem to have snagged comments or full texts of most diary entries. Luckily, someone managed to scrape most of them before they went offline.
Thanks to this archive, you can now once again hear from 21-year-old-me in the form of my old K5 diary entries which I’ve imported to my blog Copyrighteous. I fixed the obvious spelling errors but otherwise restrained myself and left them intact.
If you’re interested in preserving your own K5 diaries, I wrote some Python code to parse the K5 HTML files for diary pages and import them into WordPress using it’s XML-RPC API. You’ll need to tweak the code to use it but it’s pretty straightforward.
The ubiquity of large-scale data and improvements in computational hardware and algorithms have provided enabled researchers to apply computational approaches to the study of human behavior. One of the richest contexts for this kind of work is social media datasets like Facebook, Twitter, and Reddit.
We were invited by Jean Burgess, Alice Marwick, and Thomas Poell to write a chapter about computational methods for the Sage Handbook of Social Media. Rather than simply listing what sorts of computational research has been done with social media data, we decided to use the chapter to both introduce a few computational methods and to use those methods in order to analyze the field of social media research.
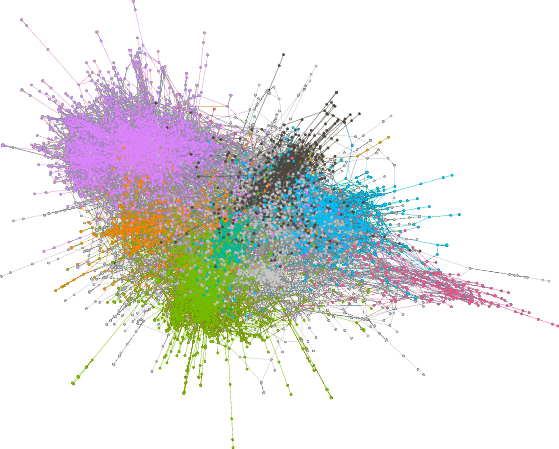
In the chapter, we start by describing the process of obtaining data from web APIs and use as a case study our process for obtaining bibliographic data about social media publications from Elsevier’s Scopus API. We follow this same strategy in discussing social network analysis, topic modeling, and prediction. For each, we discuss some of the benefits and drawbacks of the approach and then provide an example analysis using the bibliographic data.
We think that our analyses provide some interesting insight into the emerging field of social media research. For example, we found that social network analysis and computer science drove much of the early research, while recently consumer analysis and health research have become more prominent.
More importantly though, we hope that the chapter provides an accessible introduction to computational social science and encourages more social scientists to incorporate computational methods in their work, either by gaining computational skills themselves or by partnering with more technical colleagues. While there are dangers and downsides (some of which we discuss in the chapter), we see the use of computational tools as one of the most important and exciting developments in the social sciences.
One of the great benefits of computational methods is their transparency and their reproducibility. The entire process—from data collection to data processing to data analysis—can often be made accessible to others. This has both scientific benefits and pedagogical benefits.
To aid in the training of new computational social scientists, and as an example of the benefits of transparency, we worked to make our chapter pedagogically reproducible. We have created a permanent website for the chapter at https://communitydata.science/social-media-chapter/ and uploaded all the code, data, and material we used to produce the paper itself to an archive in the Harvard Dataverse.
Through our website, you can download all of the raw data that we used to create the paper, together with code and instructions for how to obtain, clean, process, and analyze the data. Our website walks through what we have found to be an efficient and useful workflow for doing computational research on large datasets. This workflow even includes the paper itself, which is written using LaTeX + knitr. These tools let changes to data or code propagate through the entire workflow and be reflected automatically in the paper itself.
If you use our chapter for teaching about computational methods—or if you find bugs or errors in our work—please let us know! We want this chapter to be a useful resource, will happily consider any changes, and have even created a git repository to help with managing these changes!
The book chapter and this blog post were written with Jeremy Foote and Aaron Shaw. You can read the book chapter here. This blog post was originally published on the Community Data Science Collective blog.