I wrote this blog post with Kaylea Champion and a version of this post was originally posted on the Community Data Science Collective blog.
Critical software we all rely on can silently crumble away beneath us. Unfortunately, we often don’t find out software infrastructure is in poor condition until it is too late. Over the last year or so, I have been supporting Kaylea Champion on a project my group announced earlier to measure software underproduction—a term we use to describe software that is low in quality but high in importance.
Underproduction reflects an important type of risk in widely used free/libre open source software (FLOSS) because participants often choose their own projects and tasks. Because FLOSS contributors work as volunteers and choose what they work on, important projects aren’t always the ones to which FLOSS developers devote the most attention. Even when developers want to work on important projects, relative neglect among important projects is often difficult for FLOSS contributors to see.
Given all this, what can we do to detect problems in FLOSS infrastructure before major failures occur? Kaylea Champion and I recently published a paper laying out our new method for measuring underproduction at the IEEE International Conference on Software Analysis, Evolution and Reengineering (SANER) 2021 that we believe provides one important answer to this question.

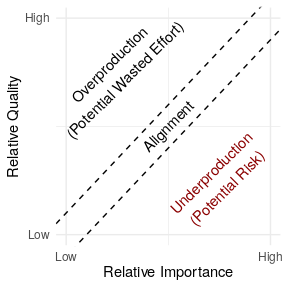
In the paper, we describe a general approach for detecting “underproduced” software infrastructure that consists of five steps: (1) identifying a body of digital infrastructure (like a code repository); (2) identifying a measure of quality (like the time to takes to fix bugs); (3) identifying a measure of importance (like install base); (4) specifying a hypothesized relationship linking quality and importance if quality and importance are in perfect alignment; and (5) quantifying deviation from this theoretical baseline to find relative underproduction.
To show how our method works in practice, we applied the technique to an important collection of FLOSS infrastructure: 21,902 packages in the Debian GNU/Linux distribution. Although there are many ways to measure quality, we used a measure of how quickly Debian maintainers have historically dealt with 461,656 bugs that have been filed over the last three decades. To measure importance, we used data from Debian’s Popularity Contest opt-in survey. After some statistical machinations that are documented in our paper, the result was an estimate of relative underproduction for the 21,902 packages in Debian we looked at.
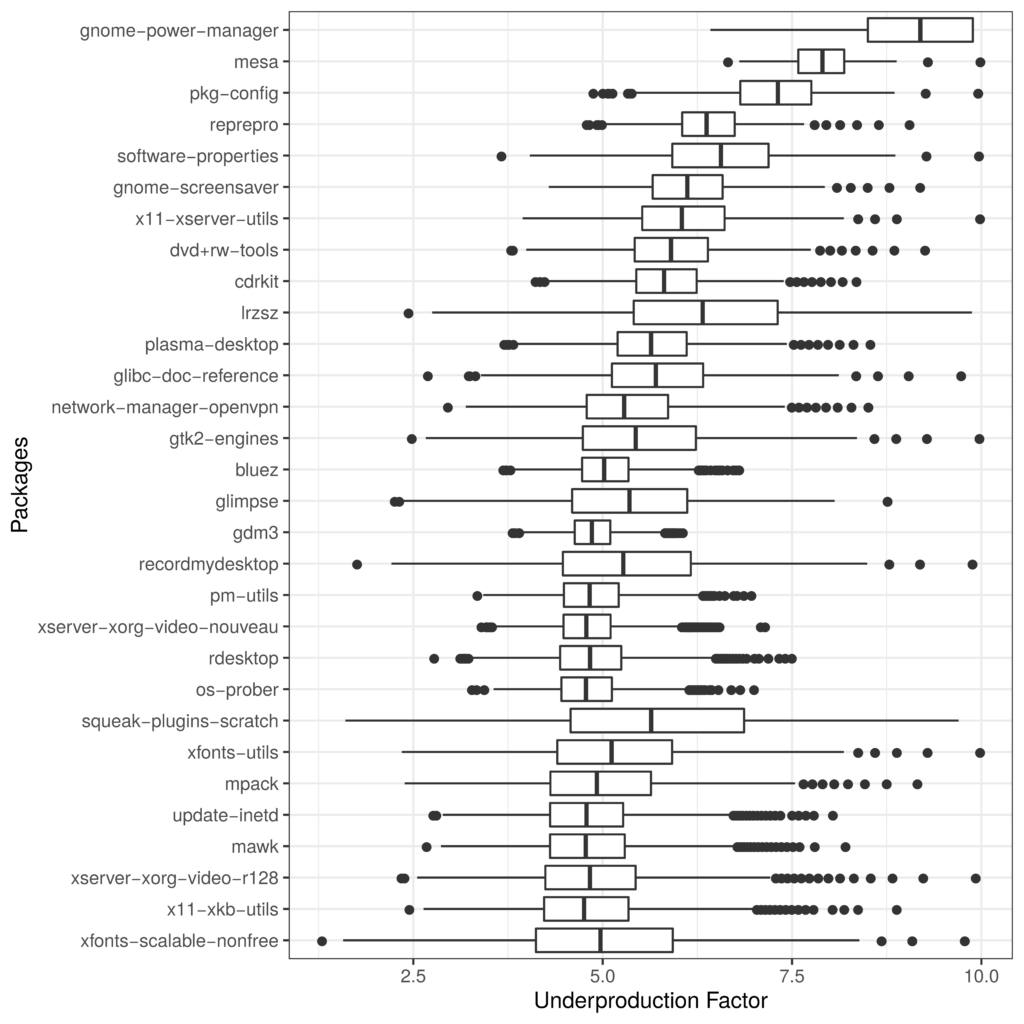
One of our key findings is that underproduction is very common in Debian. By our estimates, at least 4,327 packages in Debian are underproduced. As you can see in the list of the “most underproduced” packages—again, as estimated using just one more measure—many of the most at risk packages are associated with the desktop and windowing environments where there are many users but also many extremely tricky integration-related bugs.

We hope these results are useful to folks at Debian and the Debian QA team. We also hope that the basic method we’ve laid out is something that others will build off in other contexts and apply to other software repositories.
In addition to the paper itself and the video of the conference presentation on Youtube by Kaylea, we’ve put a repository with all our code and data in an archival repository Harvard Dataverse and we’d love to work with others interested in applying our approach in other software ecosytems.
For more details, check out the full paper which is available as a freely accessible preprint.
This project was supported by the Ford/Sloan Digital Infrastructure Initiative. Wm Salt Hale of the Community Data Science Collective and Debian Developers Paul Wise and Don Armstrong provided valuable assistance in accessing and interpreting Debian bug data. René Just generously provided insight and feedback on the manuscript.
Paper Citation: Kaylea Champion and Benjamin Mako Hill. 2021. “Underproduction: An Approach for Measuring Risk in Open Source Software.” In Proceedings of the IEEE International Conference on Software Analysis, Evolution and Reengineering (SANER 2021). IEEE.
Contact Kaylea Champion (kaylea@uw.edu) with any questions or if you are interested in following up.
Thanks for the post and the article, I tried to understand what specifically makes up this result, in particular wrt to plasma-desktop which I am one of the co-maintainers. Having packaged and maintained many packages over 15+years, I would say that plasma has a much better maintenance then many others I have seen, so I am quite surprised seeing it in this list. Maybe this refers to older data, though!?
Yes. The measure of quality is the speed at which bugs have dealt with on average historically. If things changes substantially recently for, it would take quite a bit of time for this to be reflected.
All of these measures of quality (and importance, for that matter) have flaws and limits. I’d love to try to improve this and/or add multiple measures or dimensions of package or maintenance quality. A challenge we have is that most packages aren’t used very much and few bugs so data become pretty thin pretty quickly. We could probably do a better job creating relative rankings on a subset of much more widely used packages.
This post resulted in me making this bug: https://bugs.launchpad.net/ubuntu/+source/software-properties/+bug/1921939
In this case it’s partially the lack of a properly defined upstream that is hampering things.
Nice. Kaylea and I have had some pretty in-depth conversations about extending this analysis to Ubuntu. Unfortunately, Ubuntu turned off pop-con but we have aspirations to at least looking at how things played out historically.